The Tobacco Control Data Repository was mainly developed for desktop use. The screens may look different on mobile devices.
Using links: Underlined text in the Tobacco Control Data Repository indicates a clickable link either to another page or to a document. Make sure pop-up blockers in your browser are disabled to use this feature.
How do I navigate the Tobacco Control Data Repository?
The Tobacco Control Data Repository contains a collection of graphs and maps that illustrate key findings from various data sources collected by different agencies. The graphs and maps are interactive, allowing you to select subsets of the data (filters), and to change aspects of the graphs and maps.
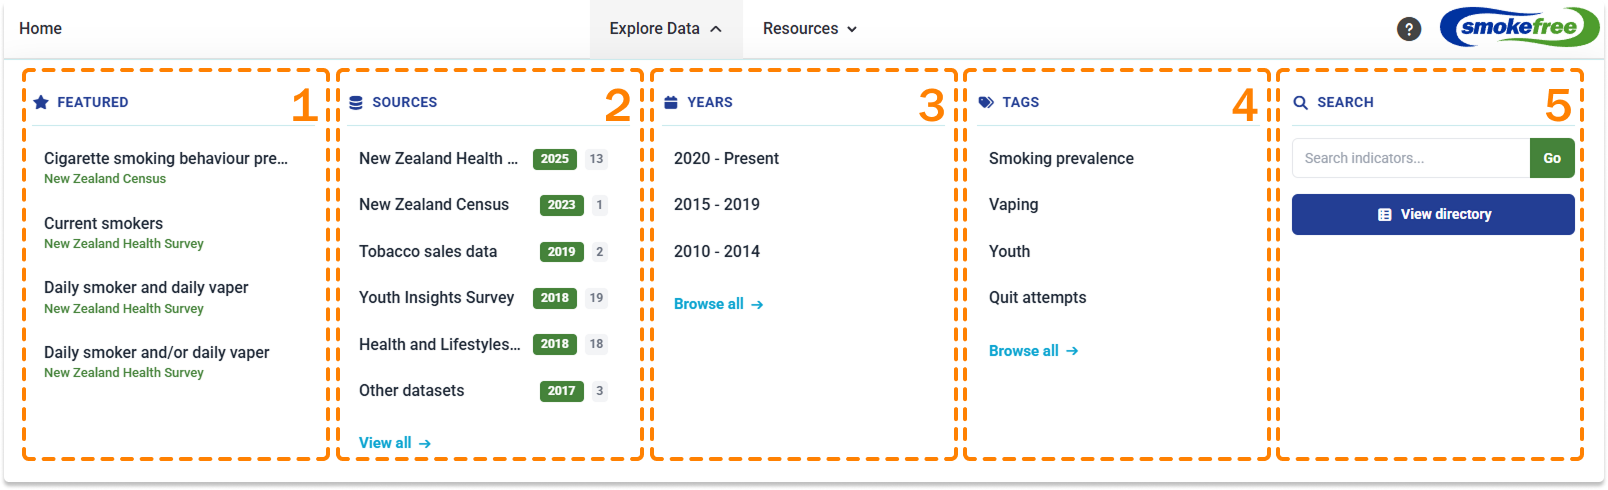
To help you find the information you are most interested in, there are five different ways to explore these data:
- by featured 1
- by data sources 2
- by years available 3
- by tags 4
- view directory 5
Explore by data sources
- From the Explore data drop-down menu at the top of the page, select By data sources 2
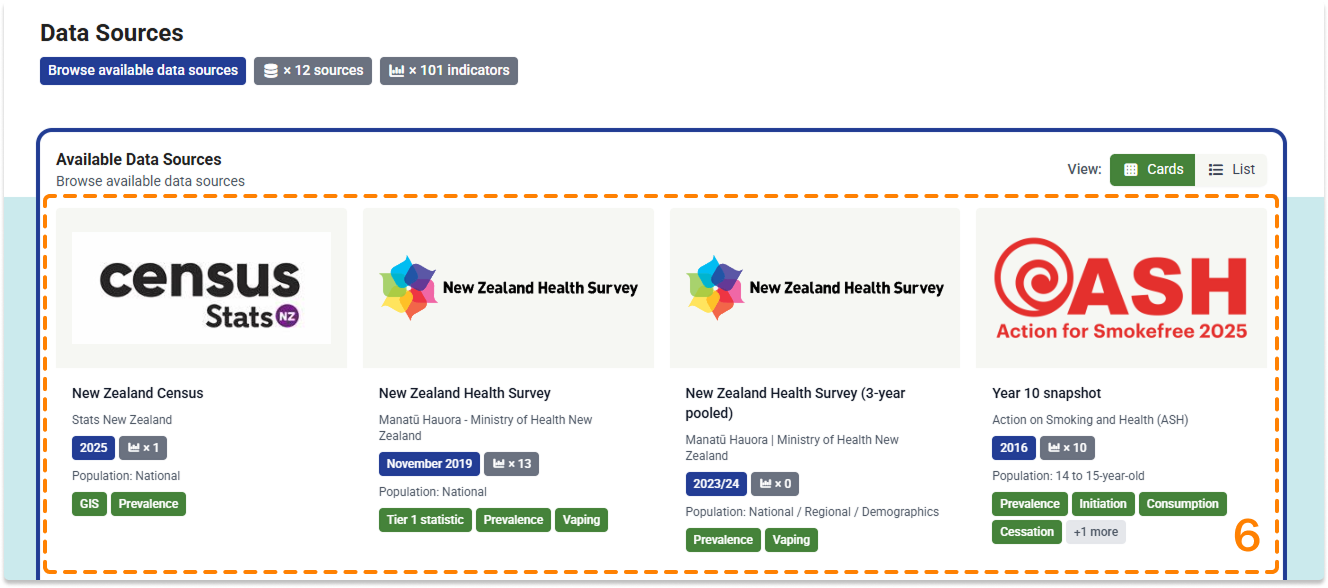
- On the data sources page you can directly access the data sources 6 . Click on a data source box to go to the respective Data source page.
- On the Data source page, click on the indicator you are interested in to go to the respective page 7 .
- You can also navigate between data sources, years or tags using the drop-down menus at the right of the page 8 .
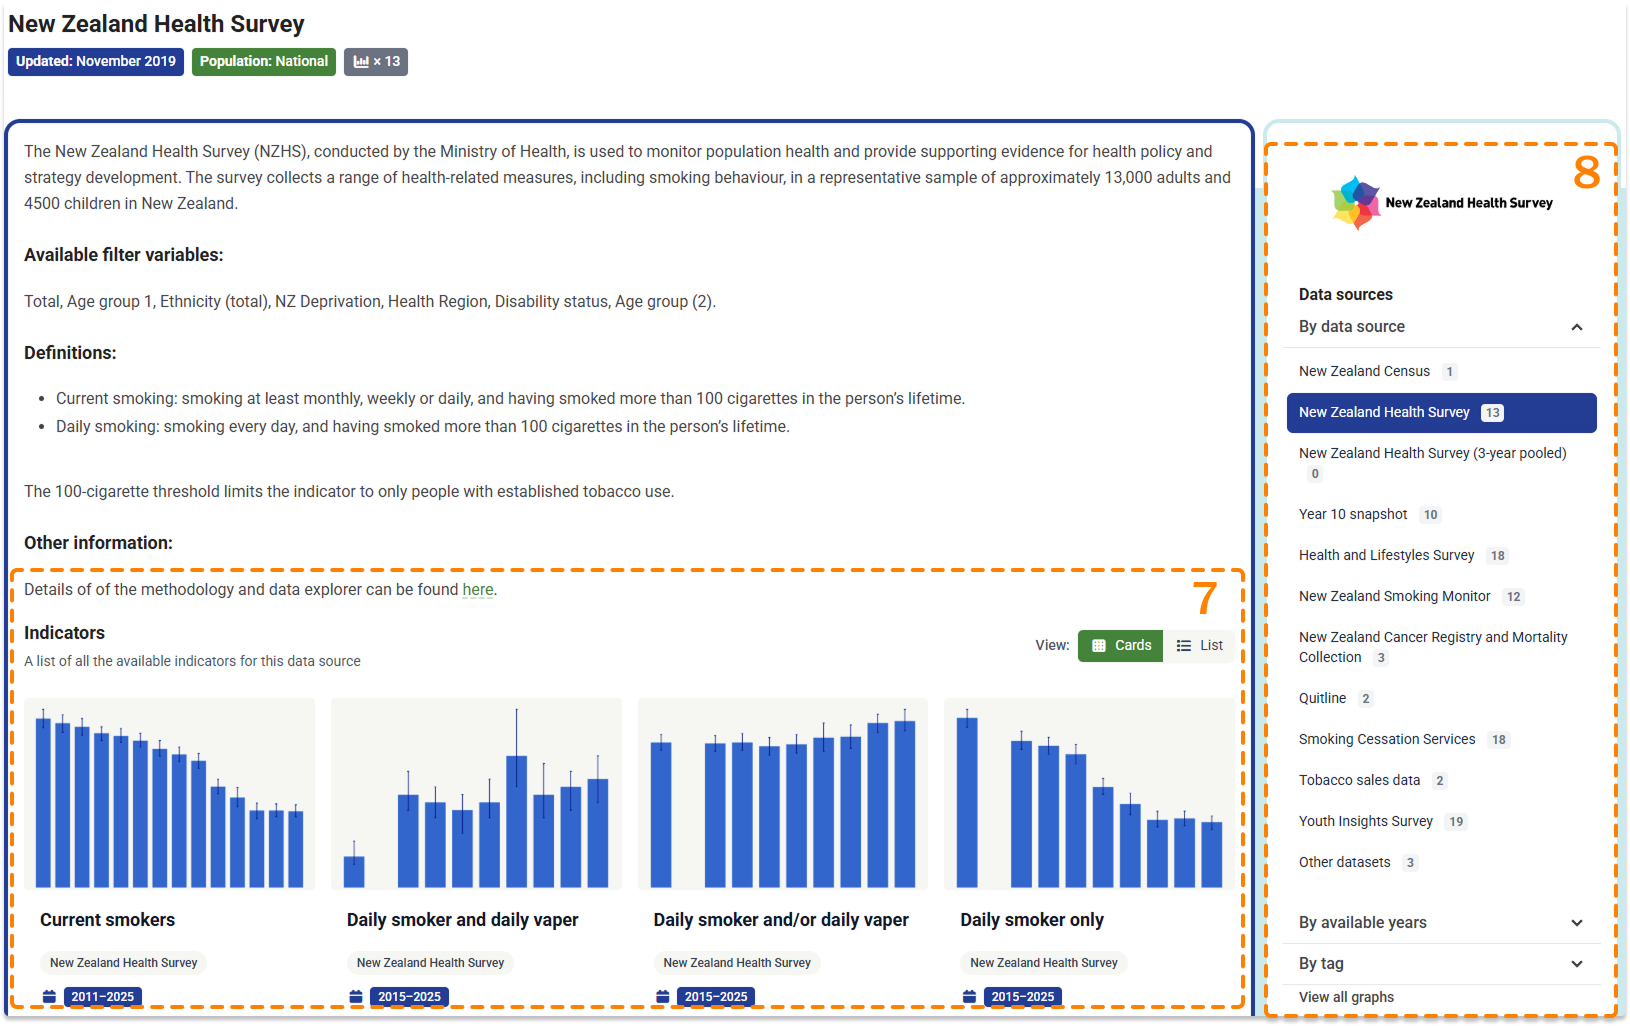
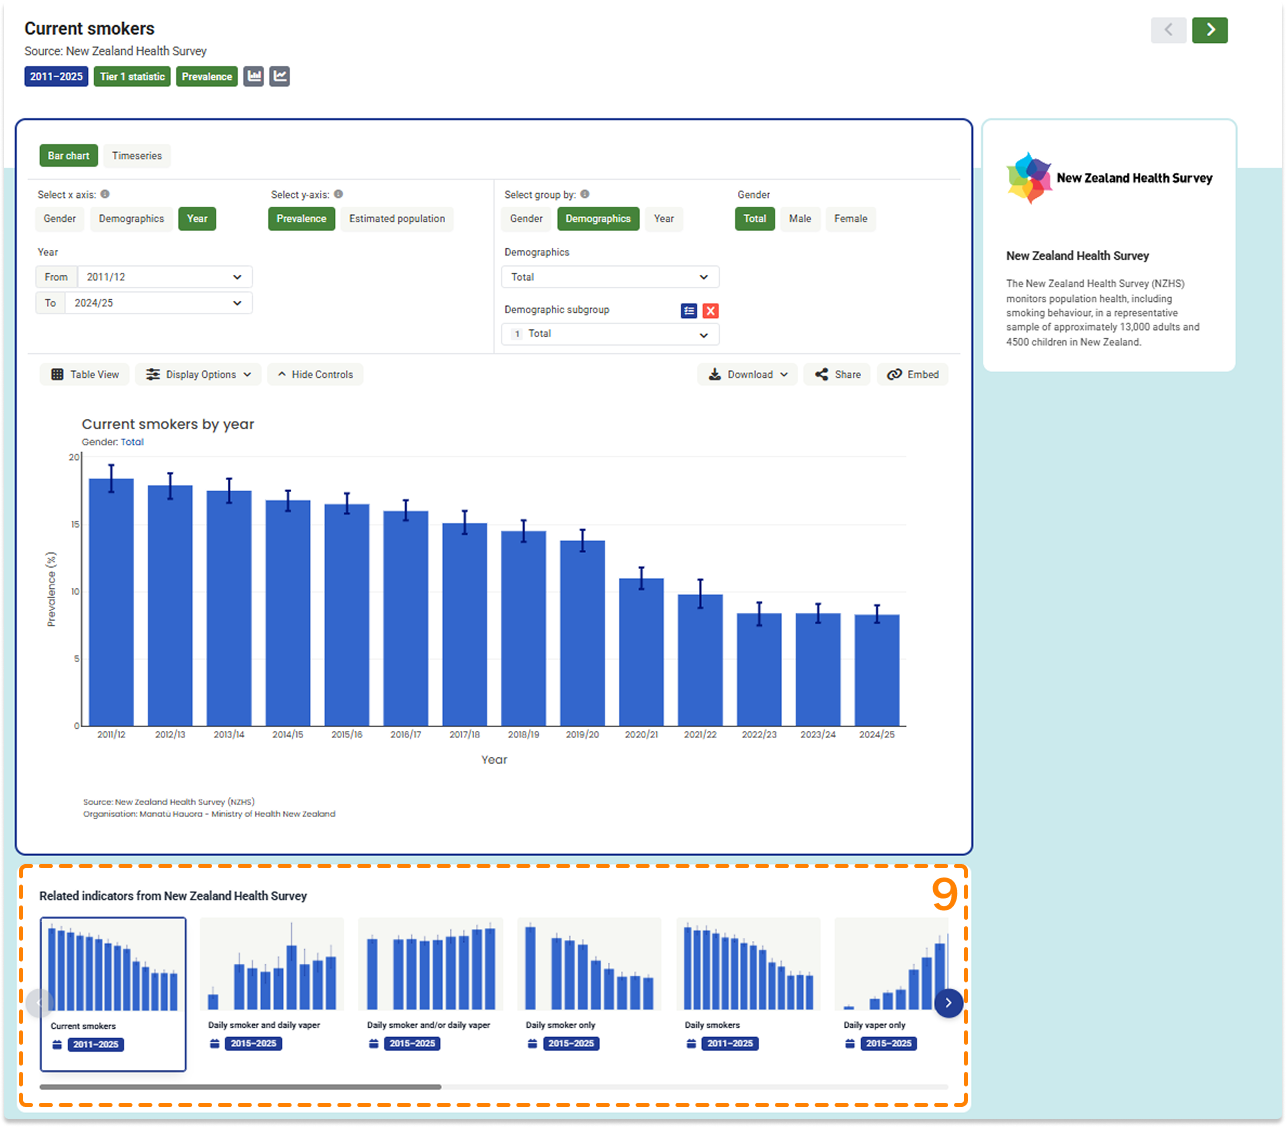
- On the Indicator page you can navigate between indicators using the list at the bottom of the page. Click on the name of the indicator to go to that chart/map 9 .
Explore by year
- From the Explore data drop-down menu at the top of the page, select By years available 3
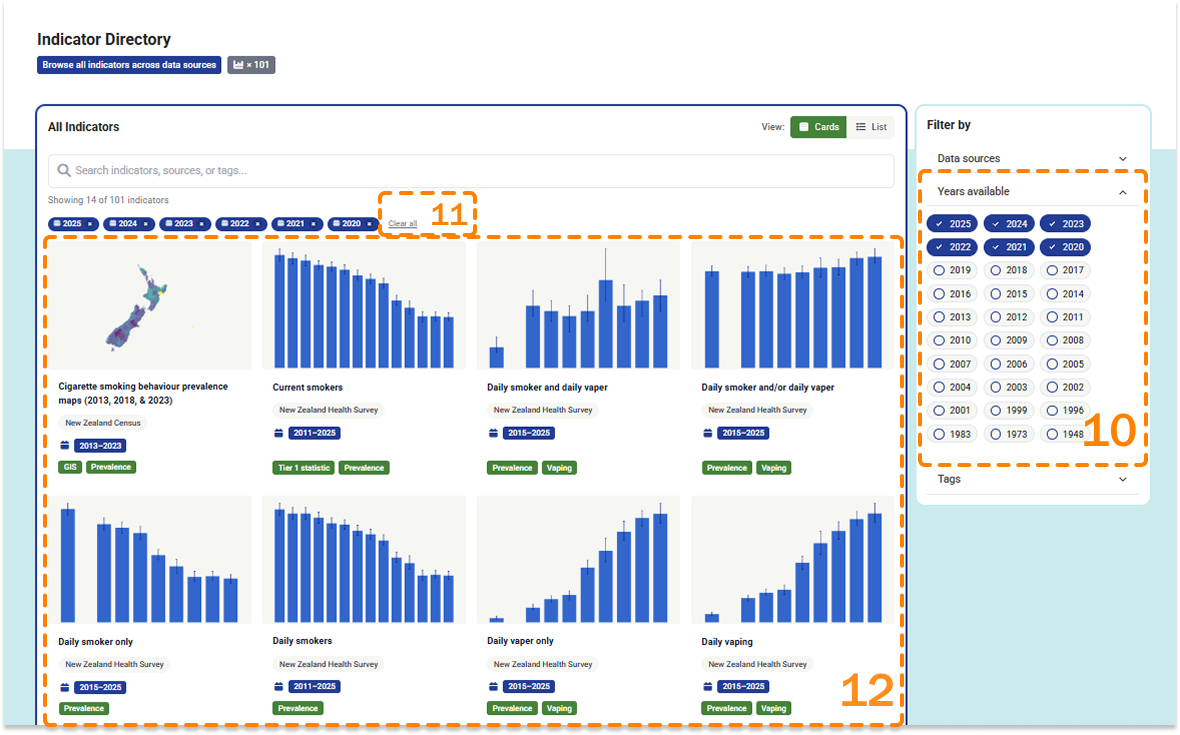
- On the Indicator directory page click on the year(s) you are interested in 10 . The indicators that include data from the selected year(s) will be listed below 12 .
Click Clear all to remove the filter(s) 11 .
From the Explore data drop-down menu at the top of the page, select By tags 4 .
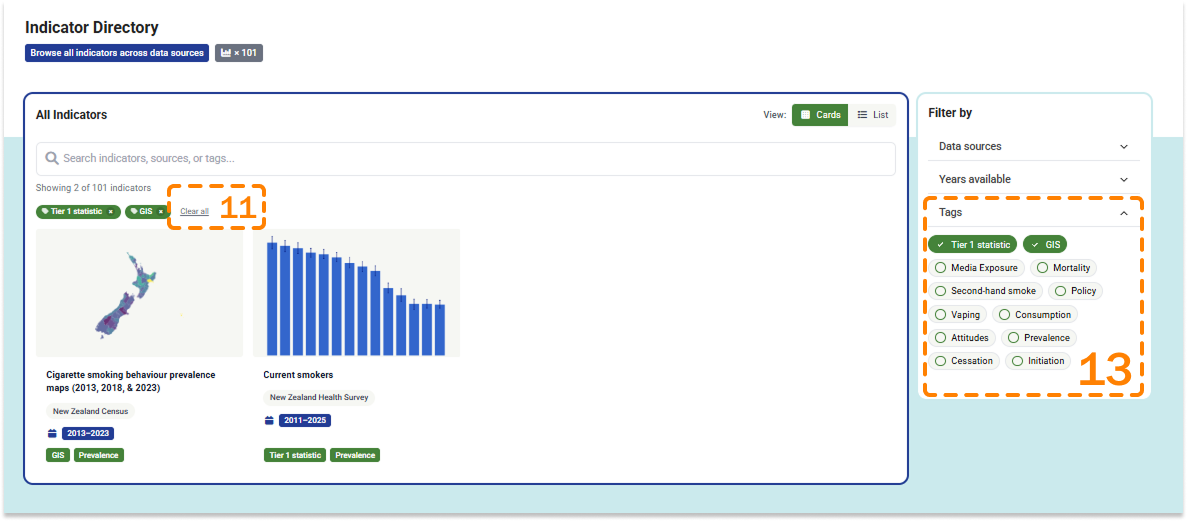
On the Indicator directory page click on the tag(s) you are interested in 13 . The indicators that include data related to the tag(s) will be listed below.
Click Clear all to remove the tag(s) 11 .
How do I view a list of all indicators?
From the Explore data drop-down menu on the Home page, select View directory 5 .
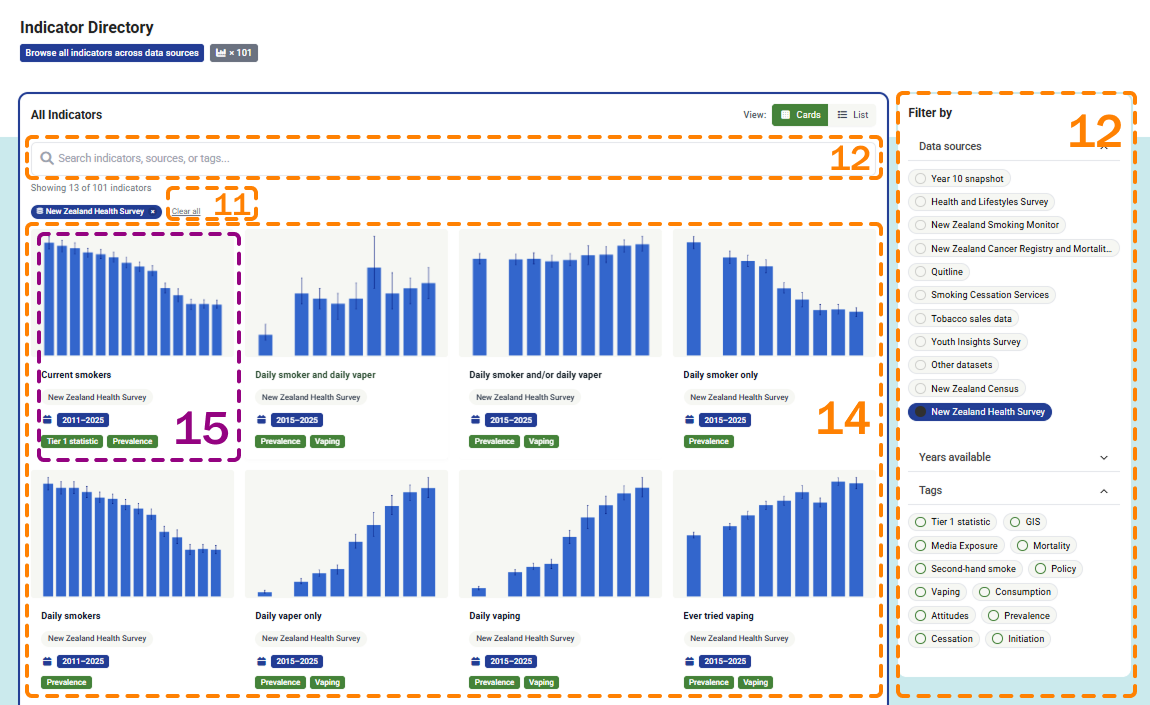
You can see a list of all available indicators 14 . The indicator list displays the indicator number, thumbnail, name of the indicator, data source, years, and tags.
Click on the name of the indicator to go to that chart/map 15 .
You can filter the indicators by data sources, years available, and tags 12 .
Click Clear all to remove the tag(s) 11 .
From the Explore data drop-down menu at the top of the page, select By data sources 2
On the Explore data sources page you can directly access the data sources. Click on a data source box to go to the respective Data source page 6 .
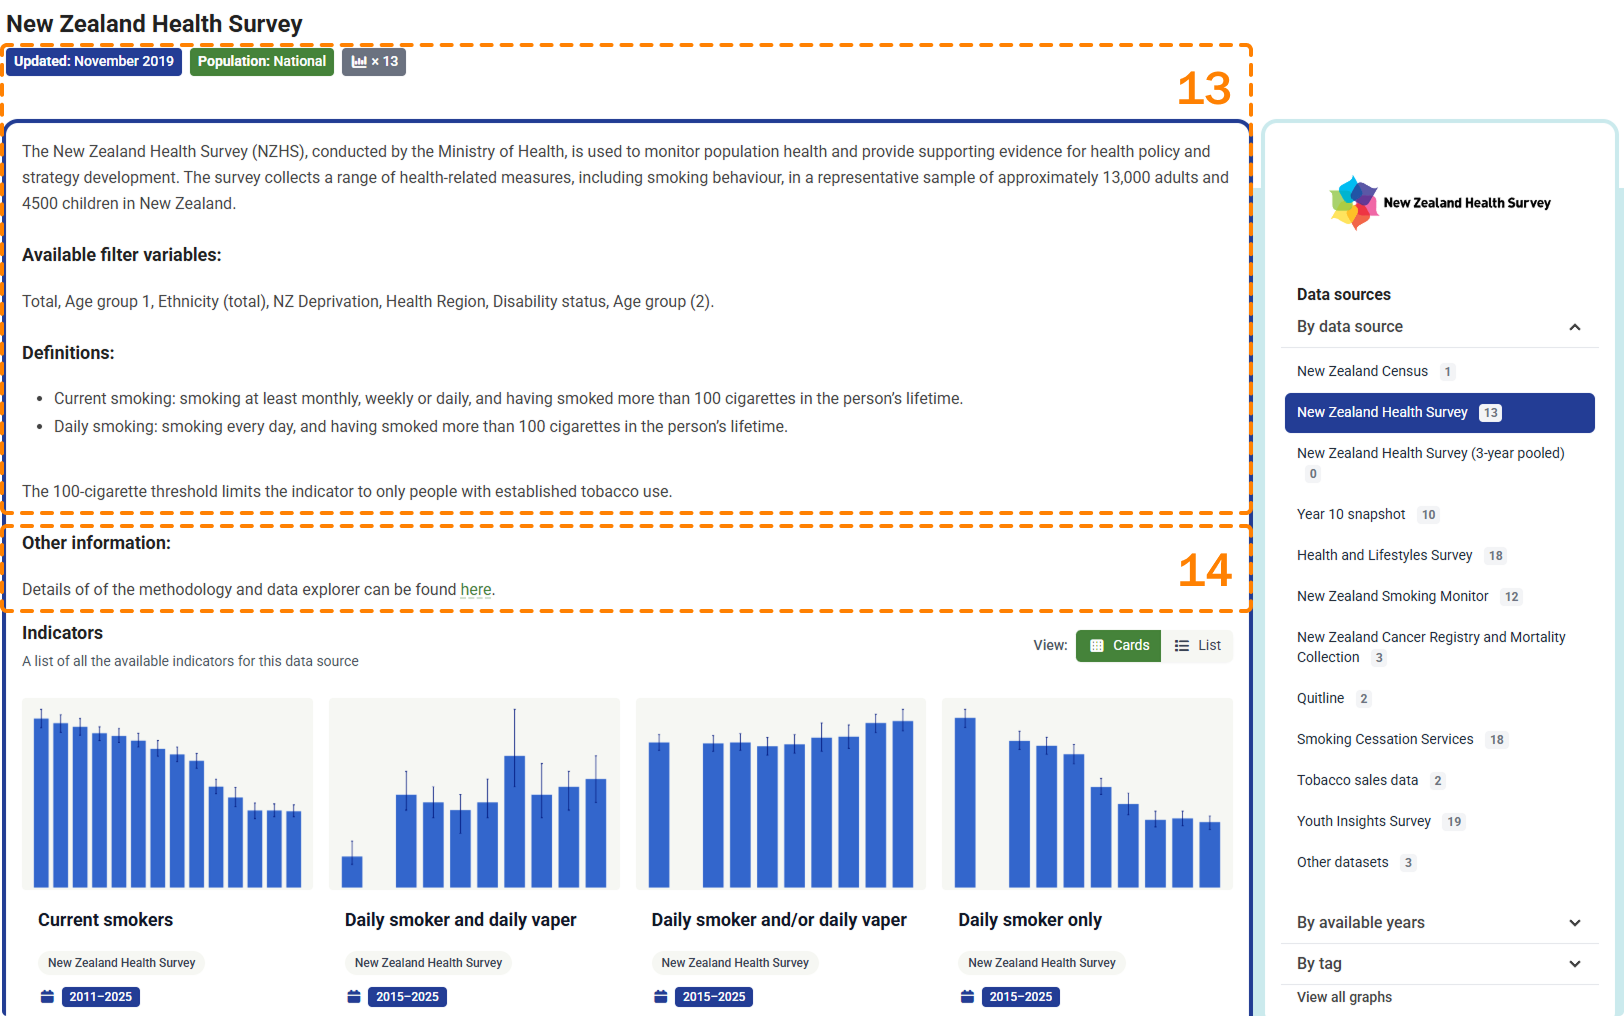
On the Data source page you may find information on the data source (name and organisation), number of indicators available, population, when the data were last updated, available filter variables/breakdowns, and definitions 13 .
You can also access other information using the links provided 14 .
How do I change the look or content of the charts?
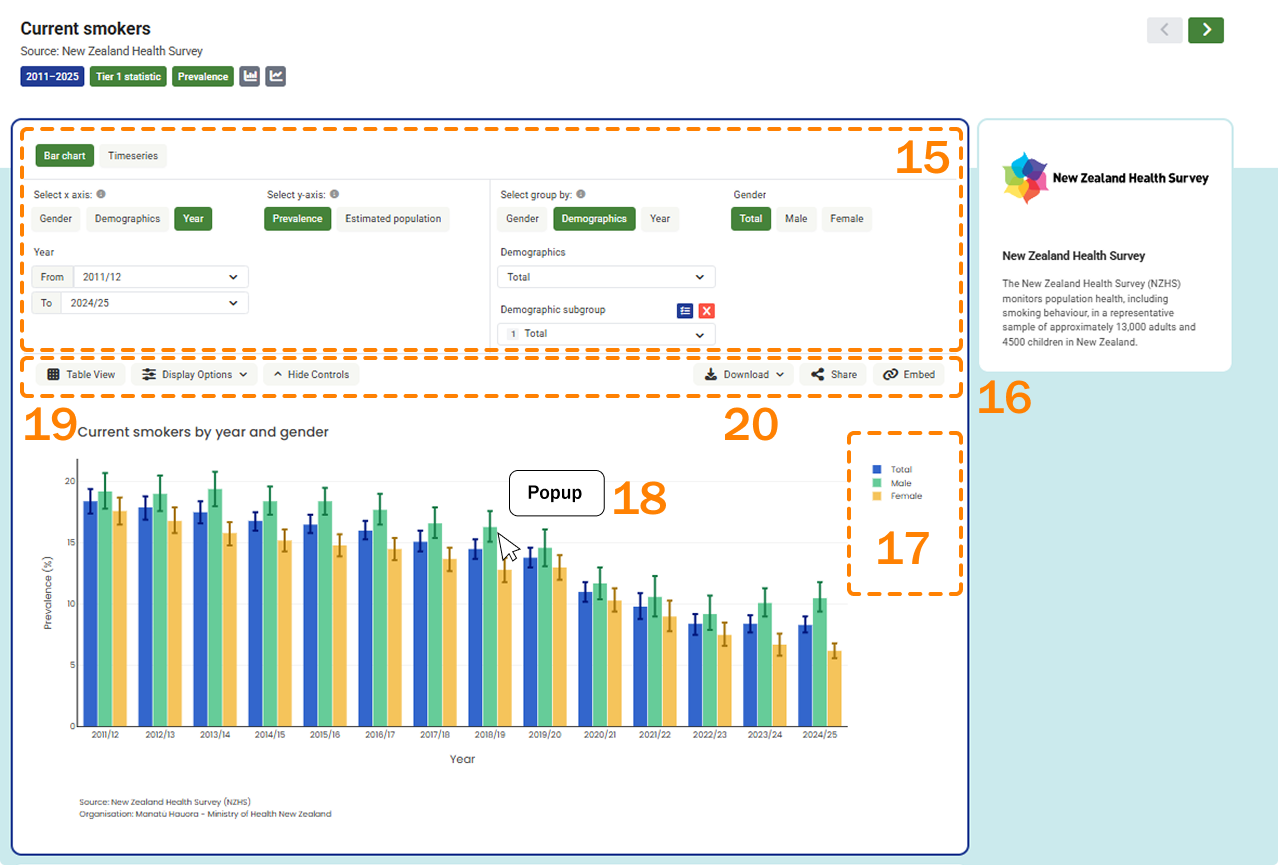
On the Indicator page, use the chart and filter controls to change what data are shown in the chart, and how the data are displayed 15 . The chart and filter controls will differ depending on the indicator.
Where available, you can select:
- the chart type – bar chart or timeseries chart
- the x-axis variable – response or category
- to show or hide the confidence interval (95%)
- the response option
- the category (e.g. total, gender, age group, ethnicity)
- the year
- Likert scale options – full or aggregated.
You can view a table of the exact data points by clicking the Show Table button 19 . Click the button again to Show Graph.
You can copy a link to the customised chart by clicking the Share or Embed buttons 20 .
You can download the customised chart as a .png file by clicking the Download button 20 .
By clicking on an item in the legend 17 a subgroup or feature can be hidden or shown in the chart.
How can I access exact values for the data points in the charts?
On the Indicator page, hover over the data point(s) or bar(s) in the charts to see the exact values 18 .
You can view a table of the exact data points by clicking the Show Table button 19 .
How can I access exact values for the data points on the maps?
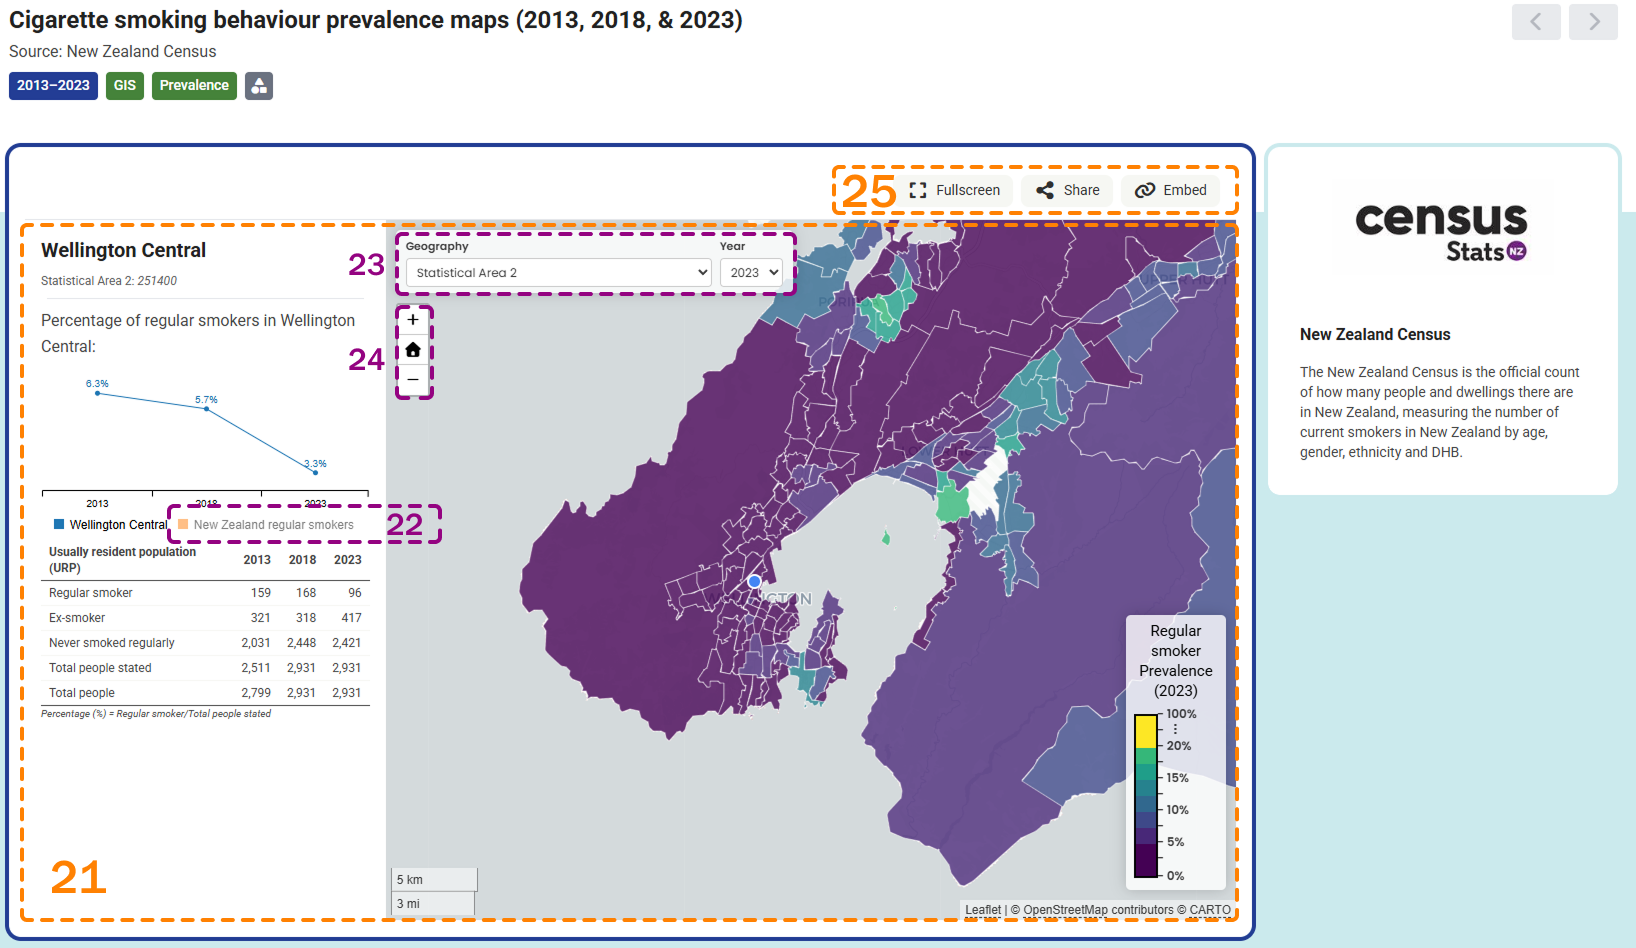
On the Indicator page, click on the geographical area you are interested in and a table and chart with exact data values will appear on the left of the screen 21 .
On the chart, you can toggle the New Zealand data on/off by clicking the data label 22 .
You can change the year or geographical area shown on the map by clicking on an item in the legend(s) 23 .
How do I change the geographical areas displayed in the maps?
On the Indicator page, click on an item in the legend to change the geographical areas shown on the map 23 .
Zoom in or out using the Zoom buttons 24 .
Copy a link to the customized map by clicking on the Share or Embed buttons 25 .
To view the map in full screen mode, click the Fullscreen button 25 . To leave full screen mode, click the back button on your browser.
To save an image the map use the snipping-tool application.
What data downloads are available?
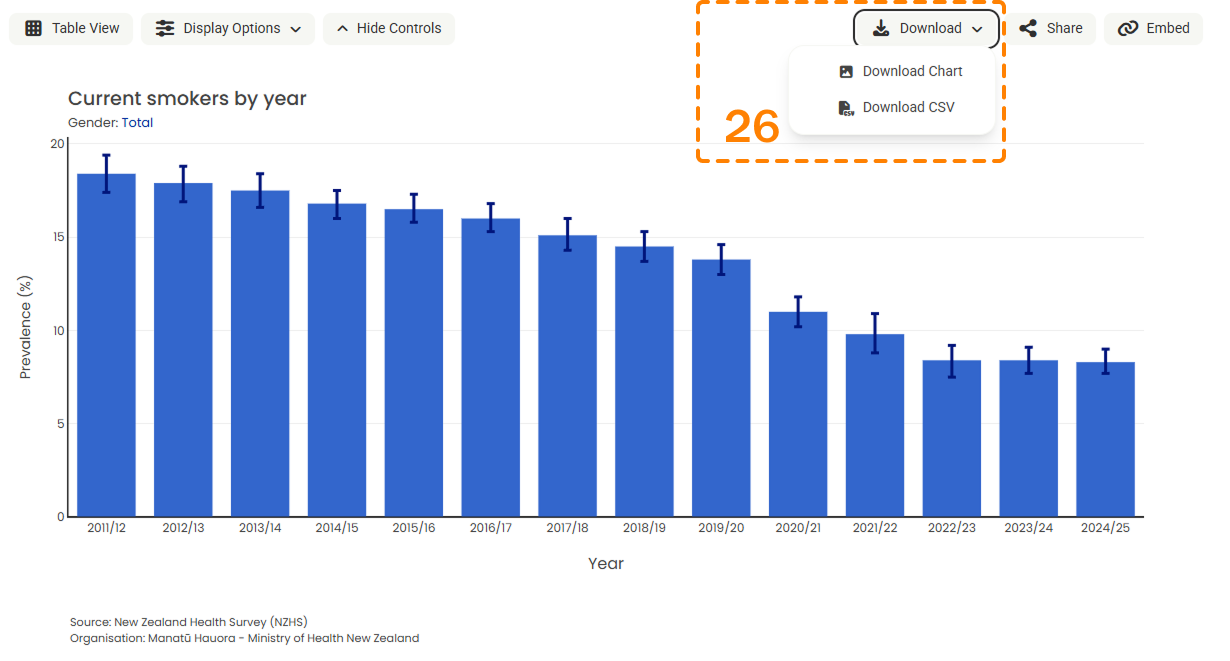
Full datasets cannot be downloaded from the Tobacco Control Data Repository. See the original data source for details on data access.
You can download table data in .csv format from the download dropdown 26 .
You can download chart images in .png format from the download dropdown 26 .