All Indicators
View:
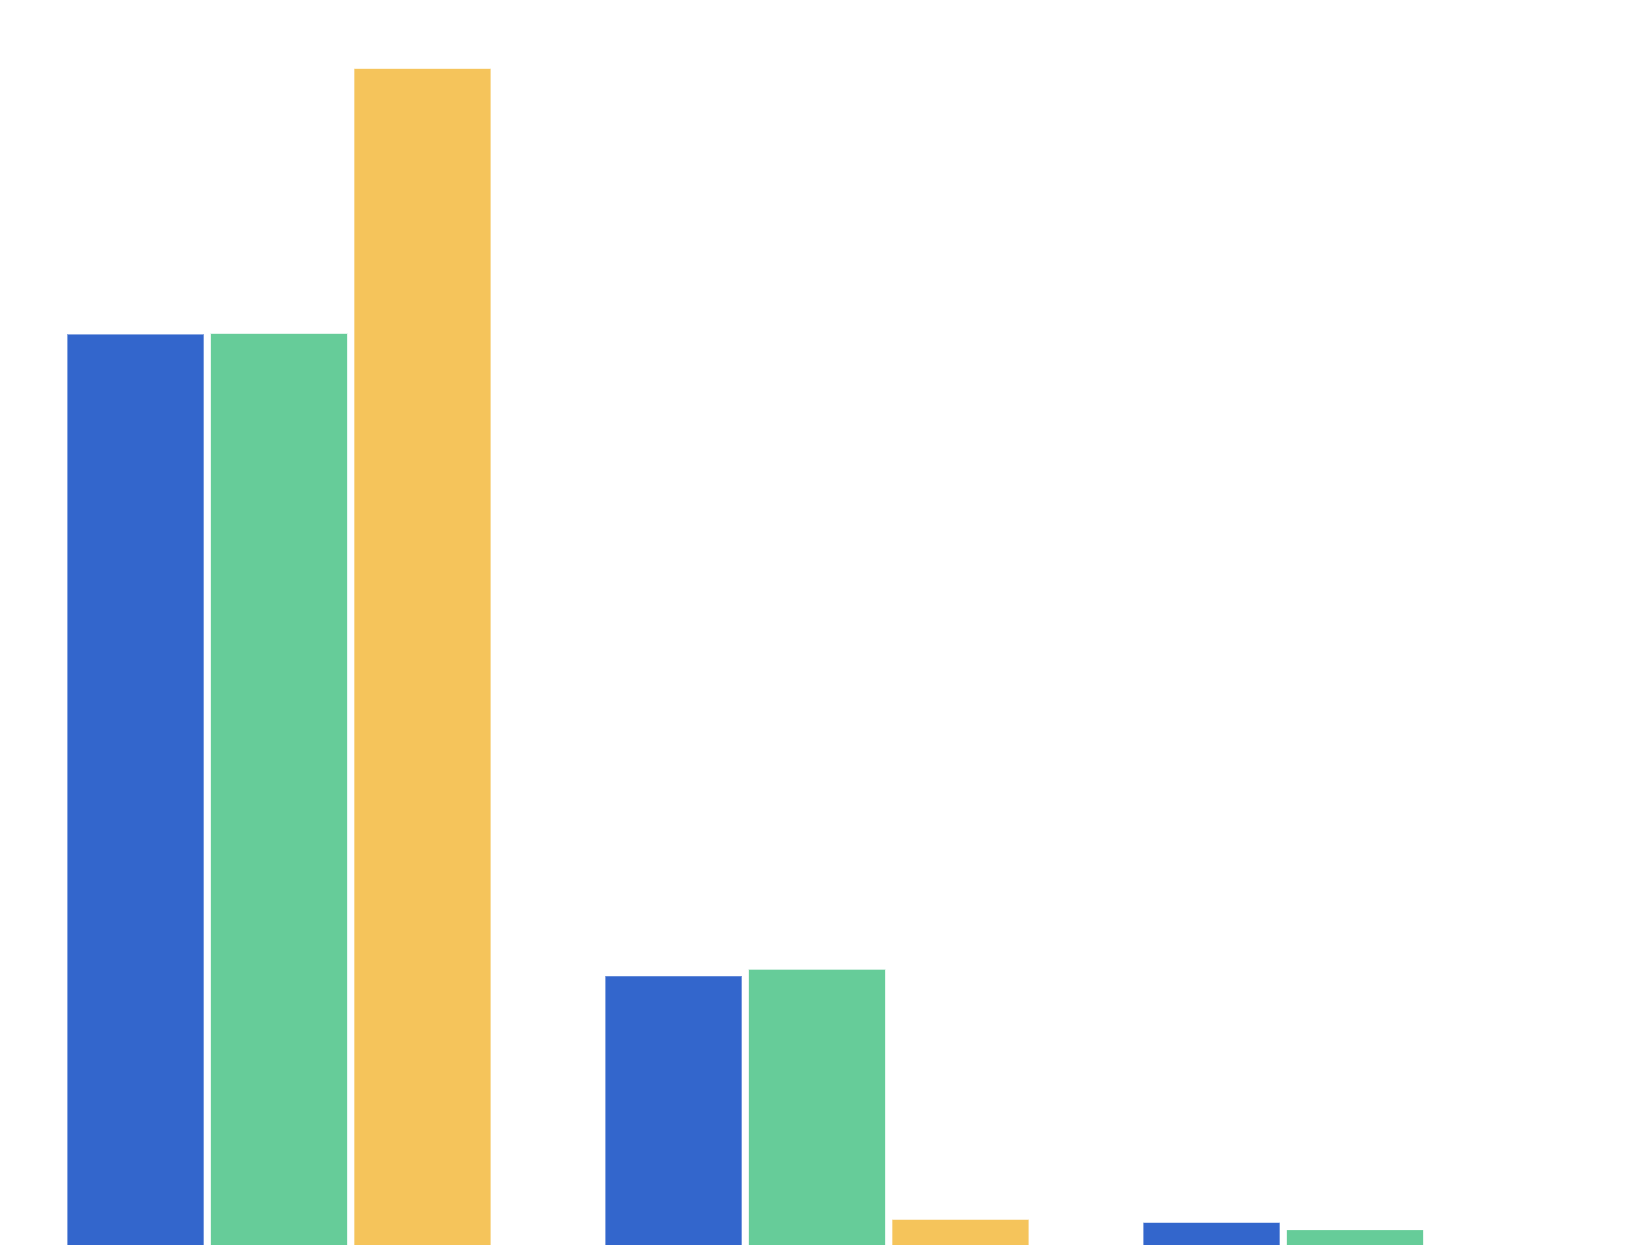
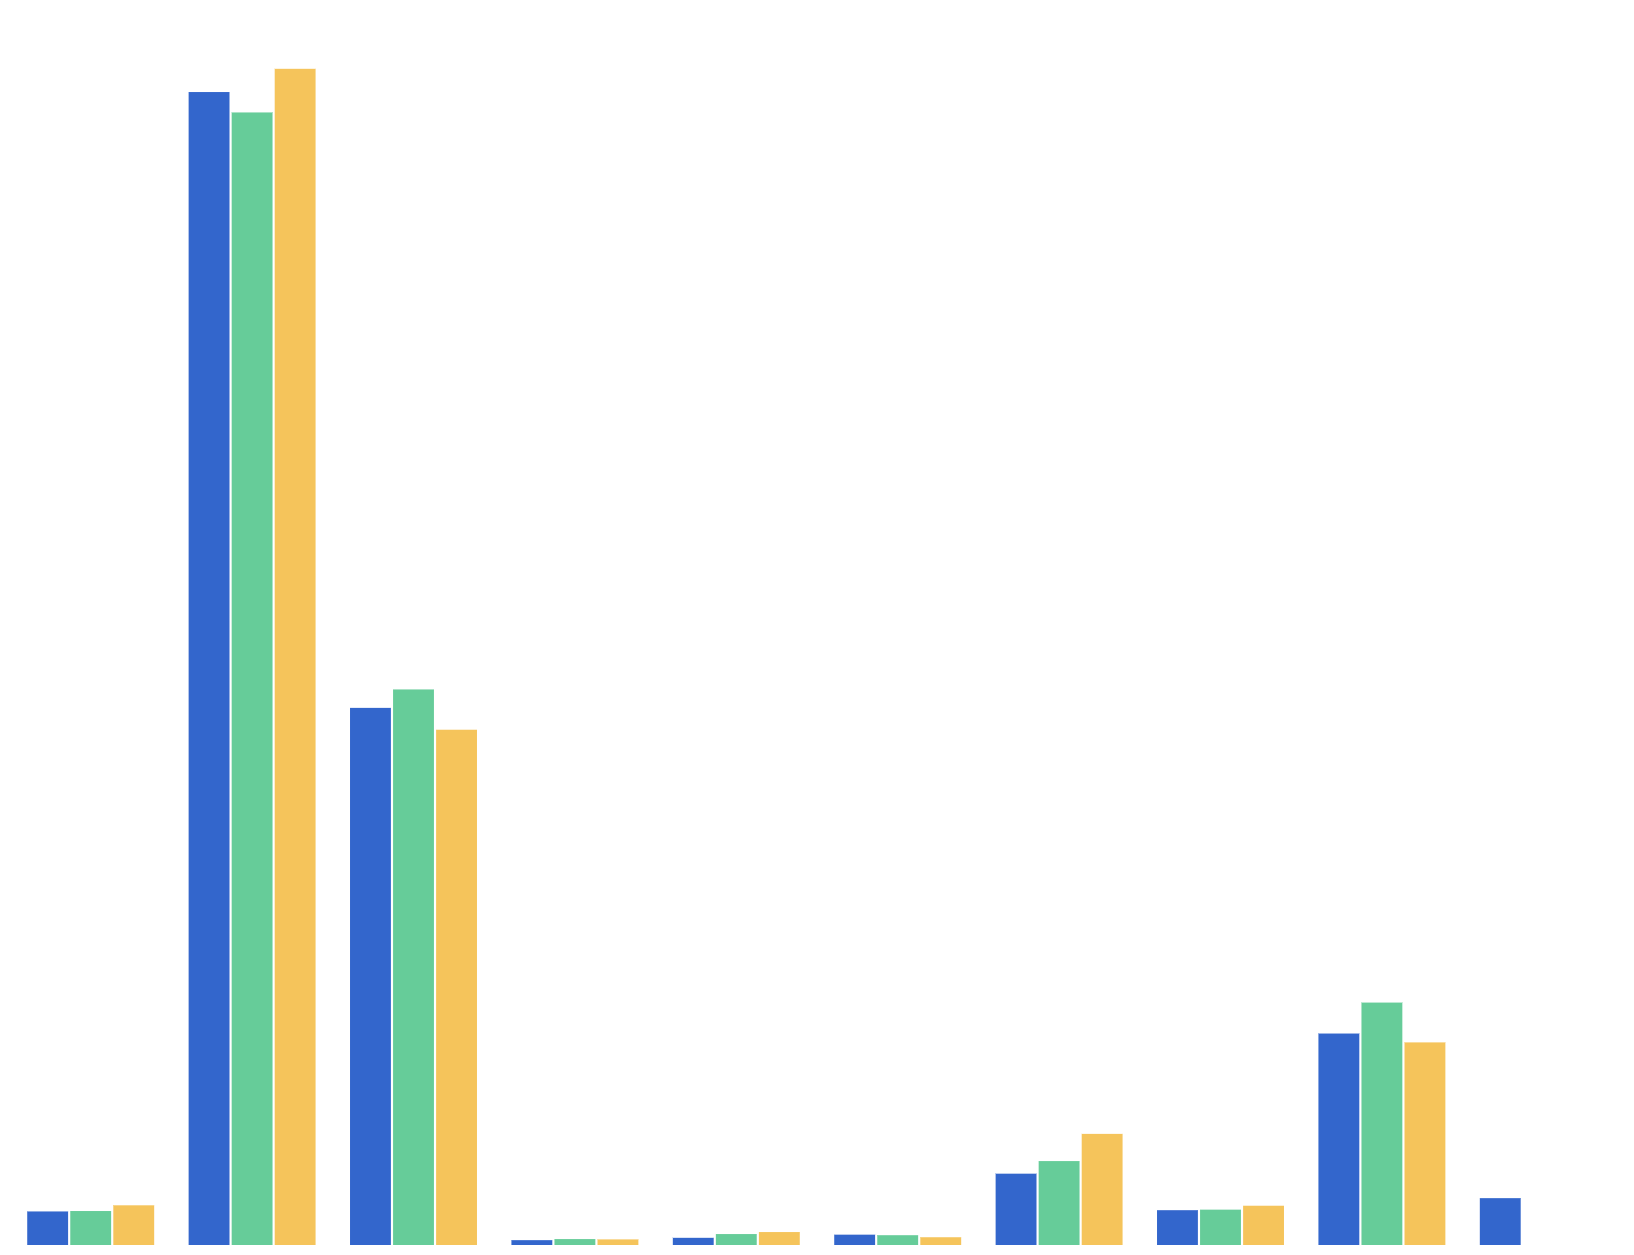
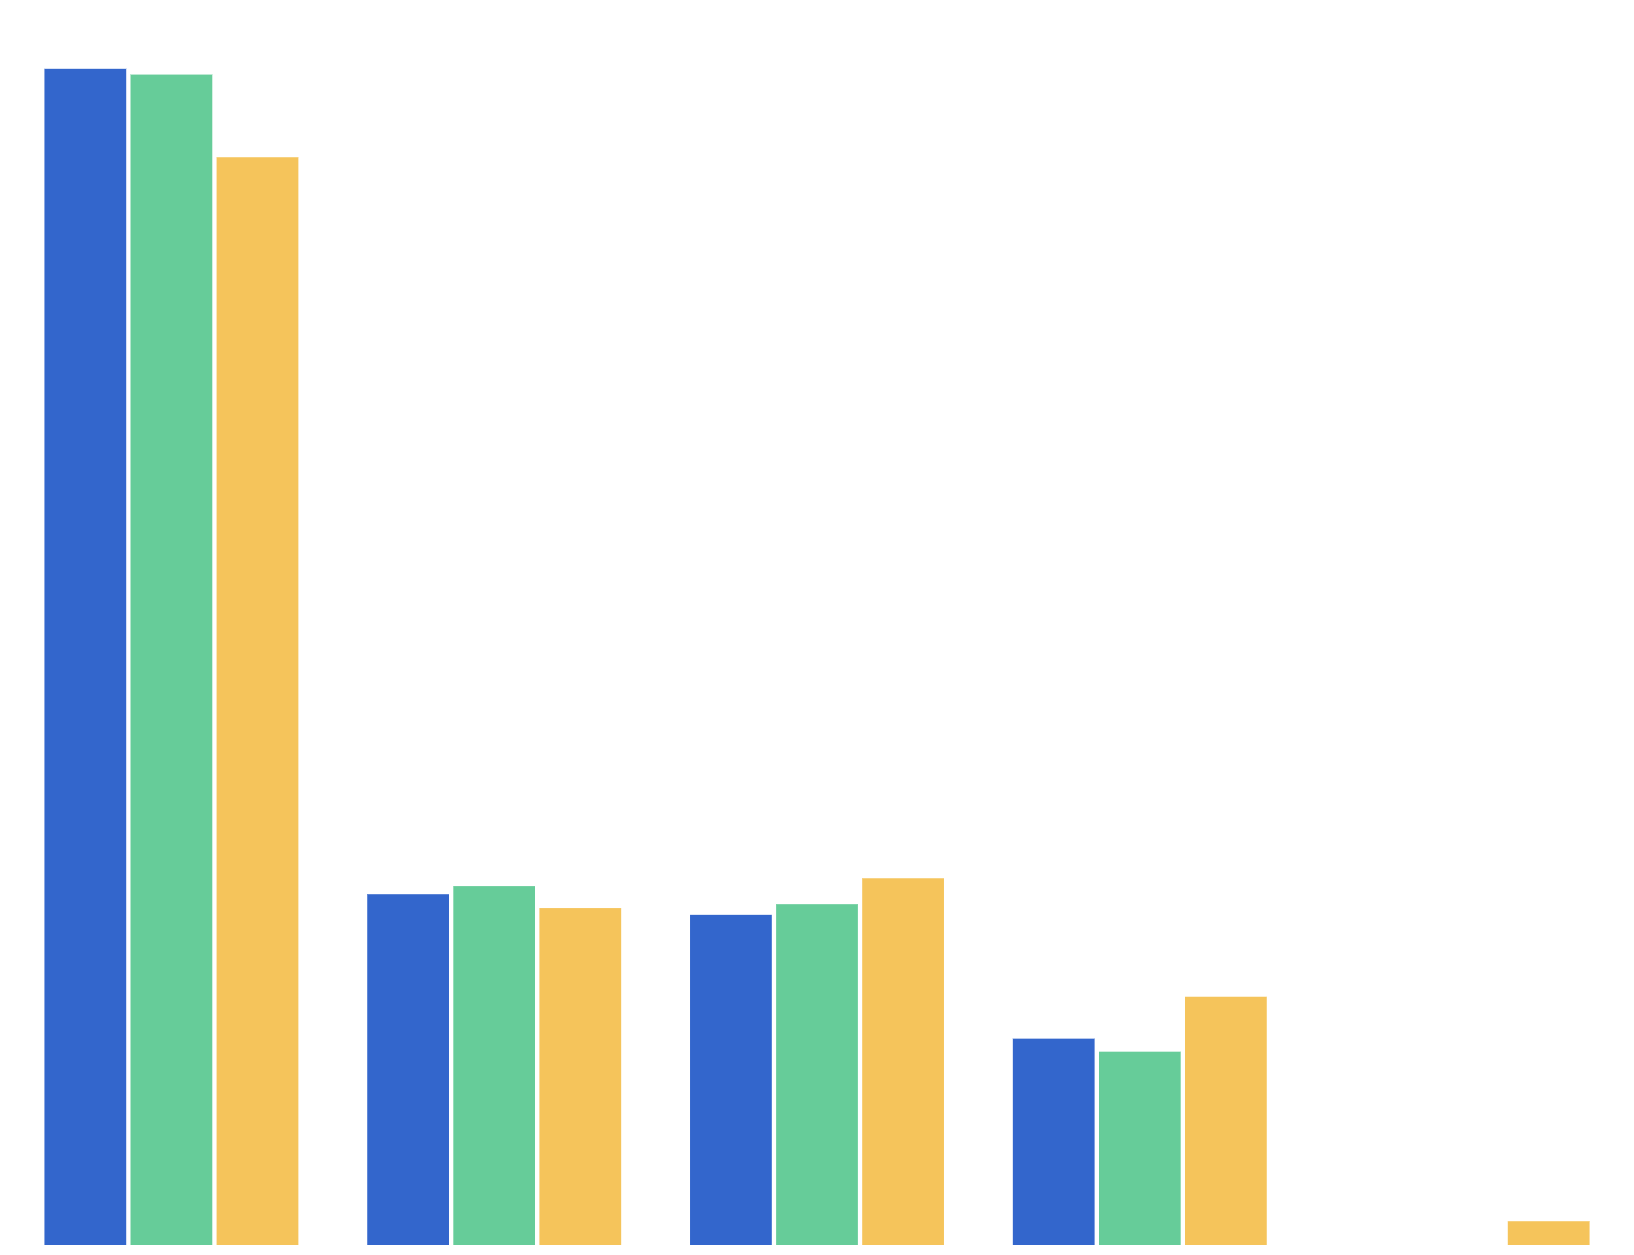
Ever smoked a cigarette
Year 10 snapshot
1999–2016
Prevalence Initiation
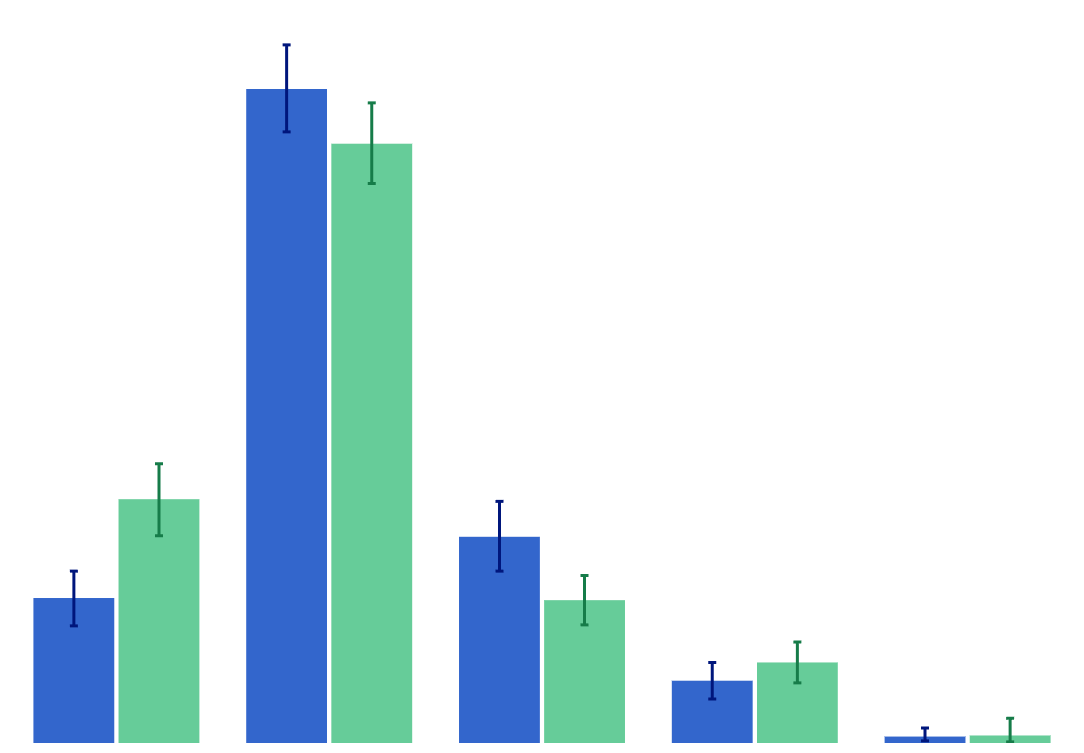
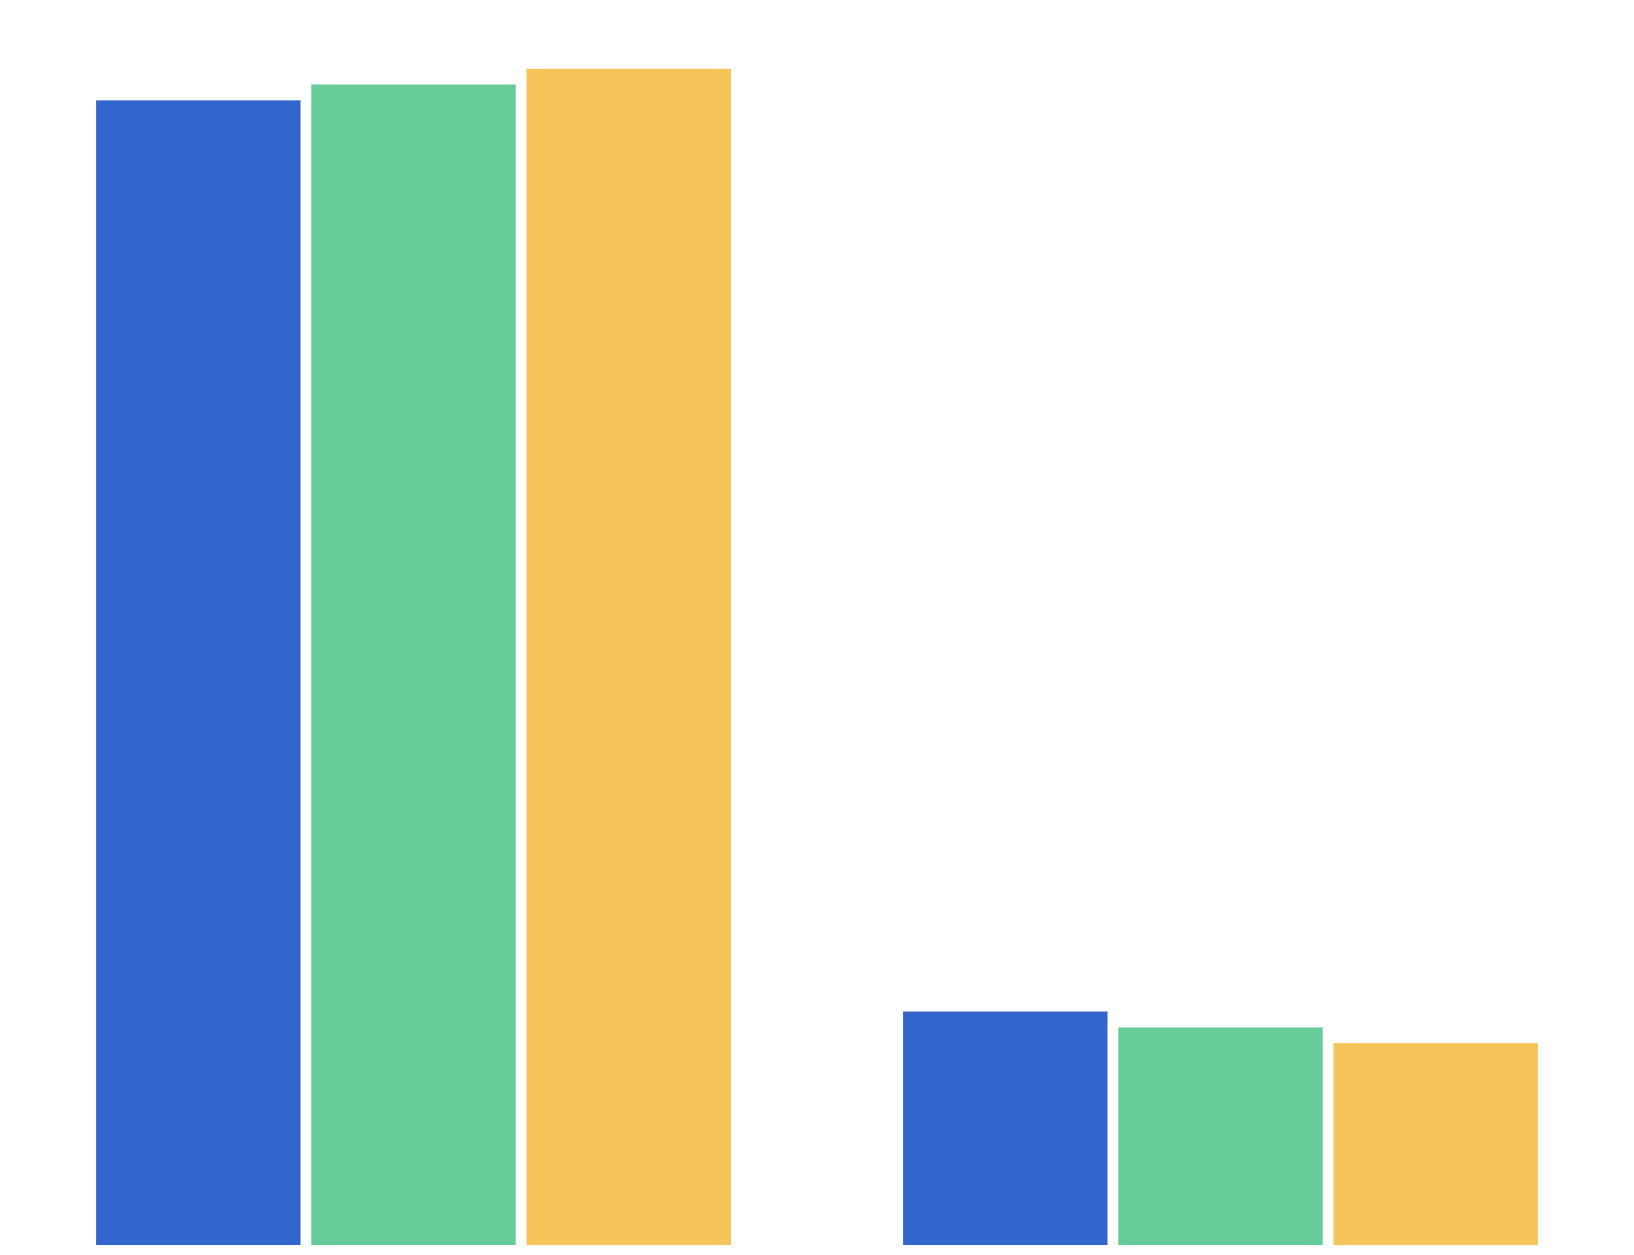
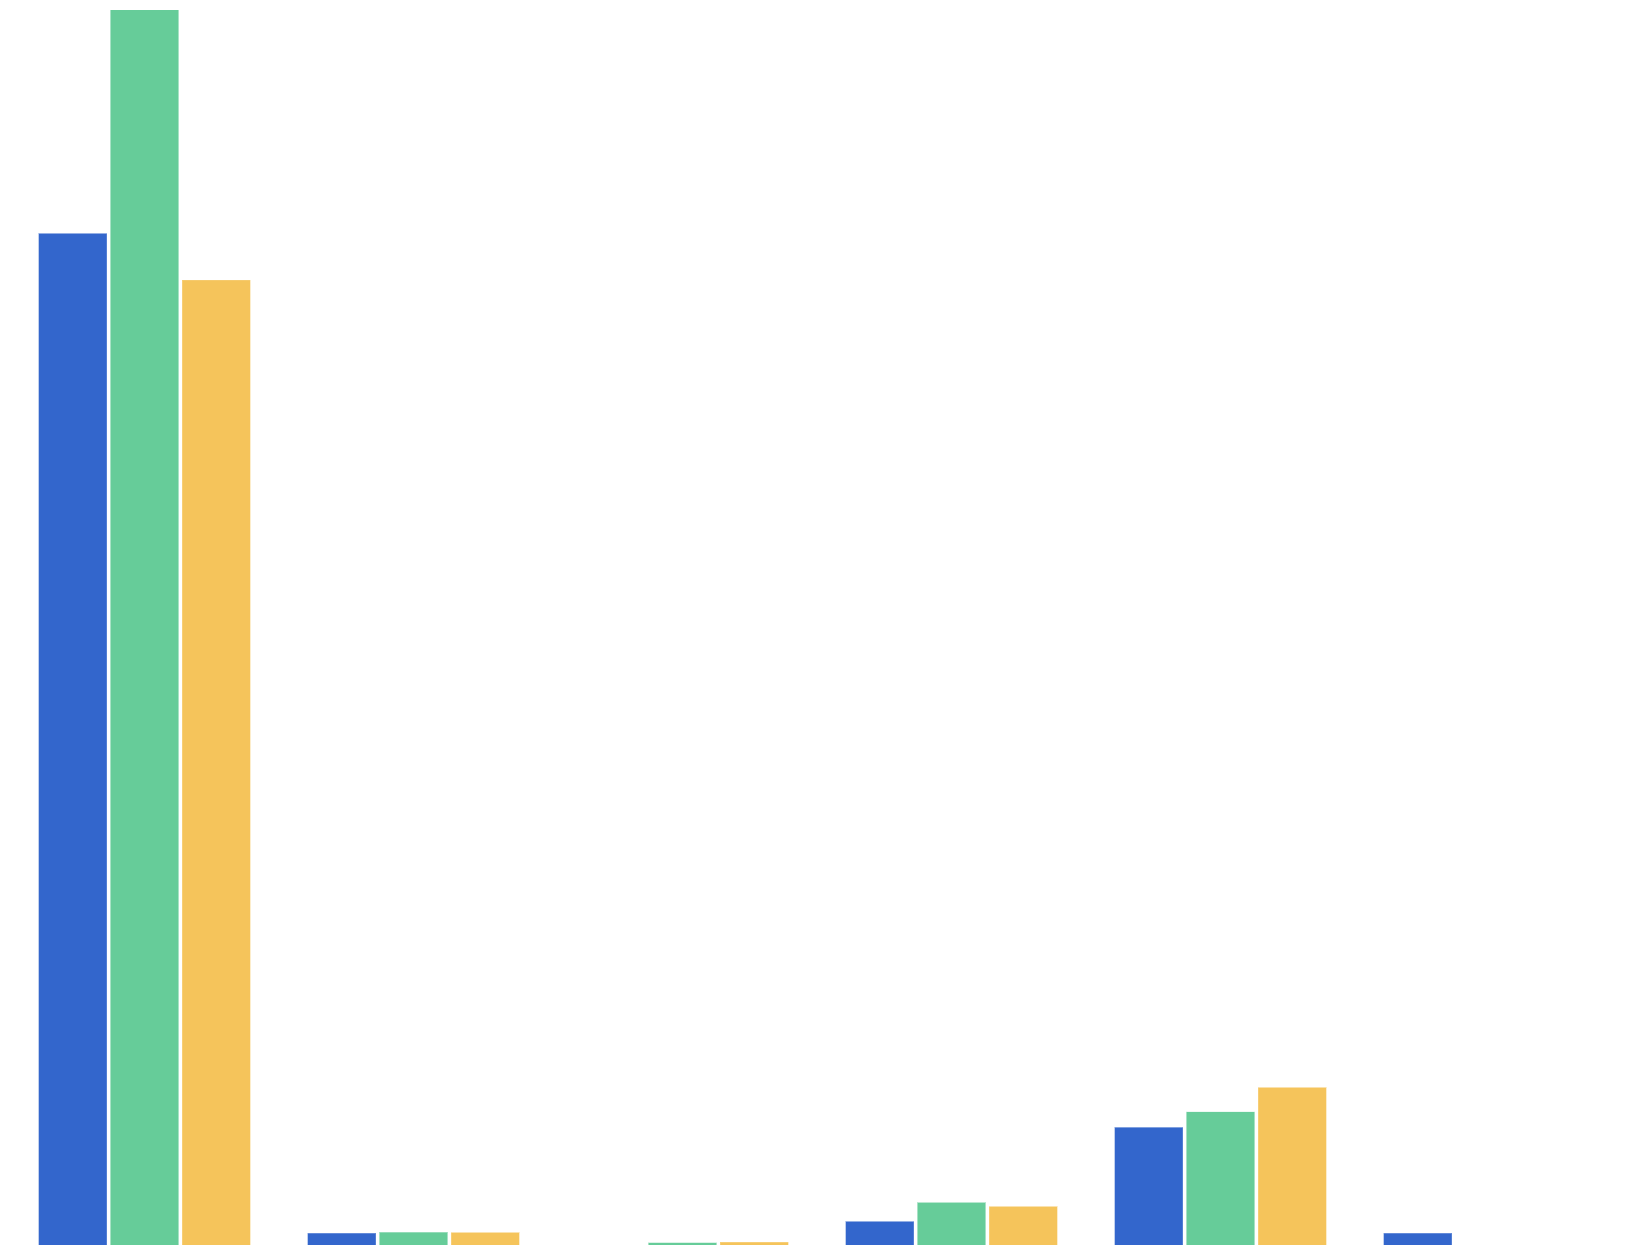
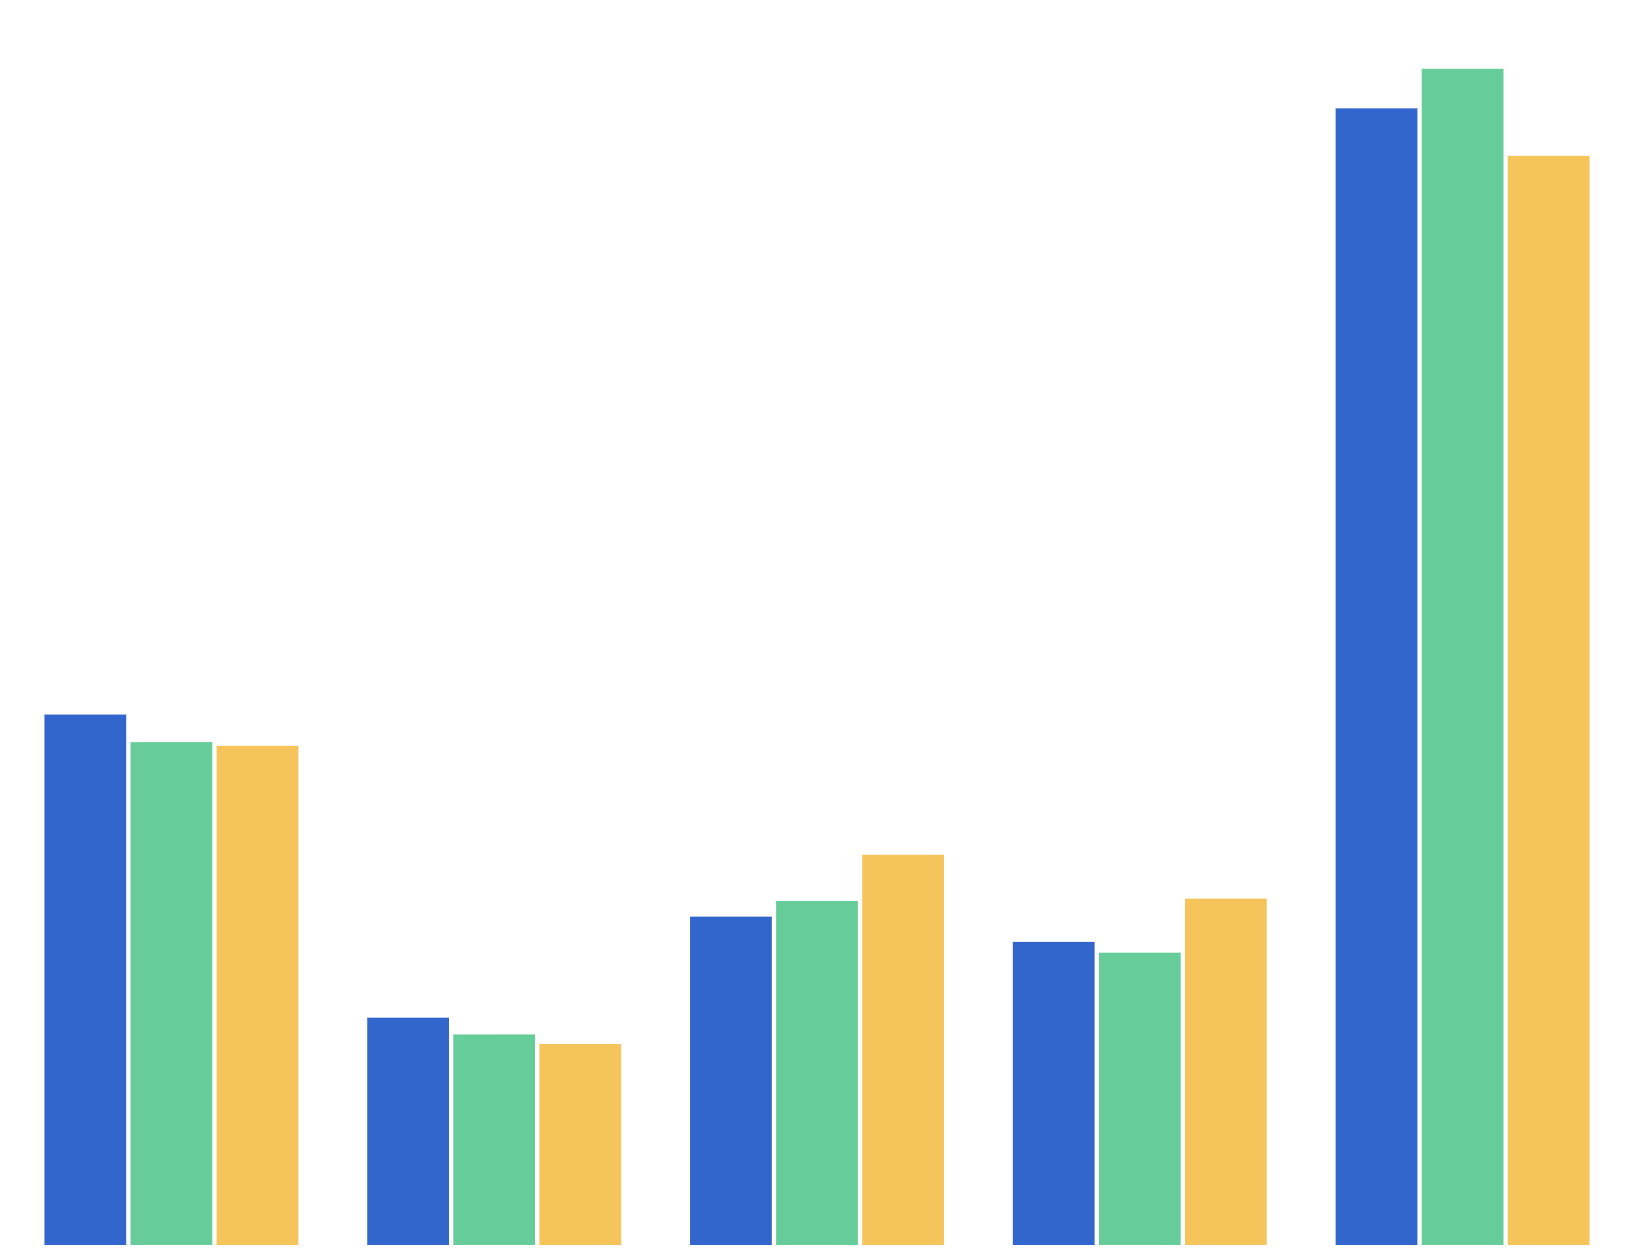
Number of cigarettes smoked in a lifetime
Year 10 snapshot
2006–2016
Initiation Consumption
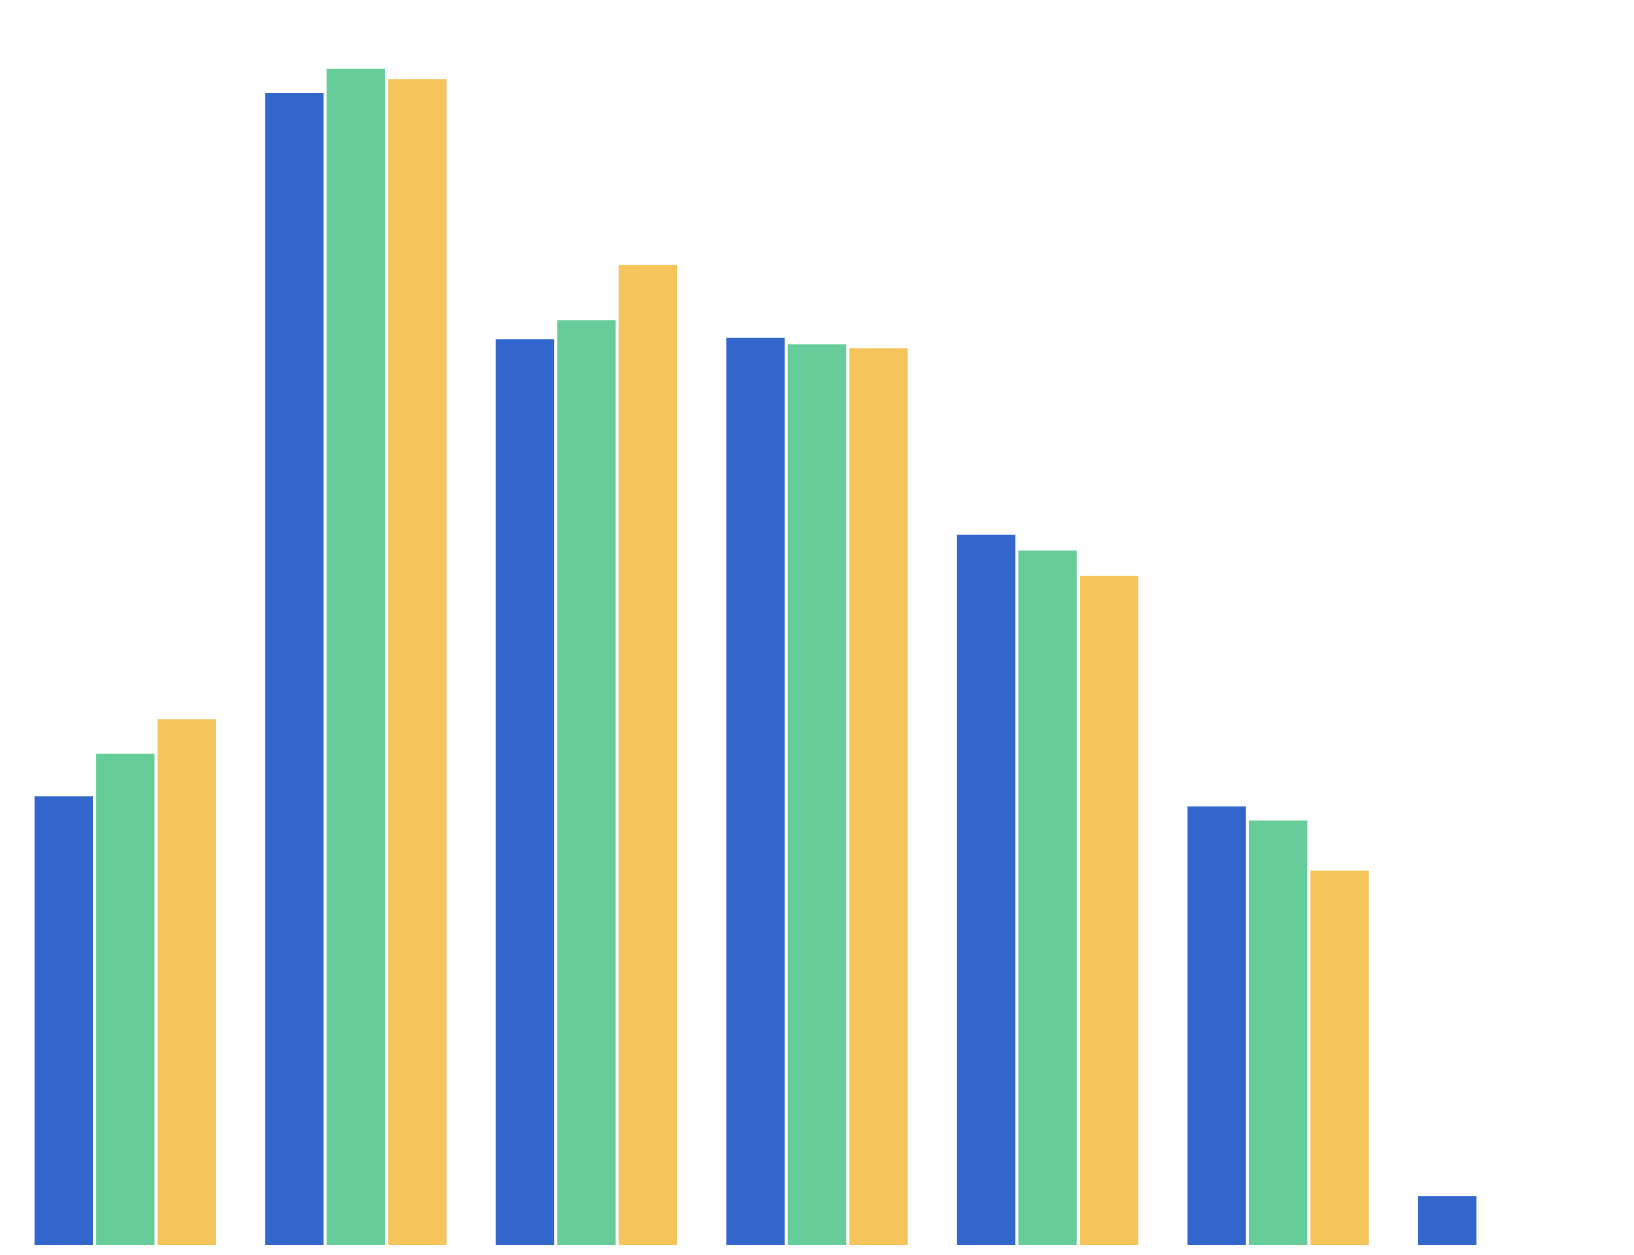
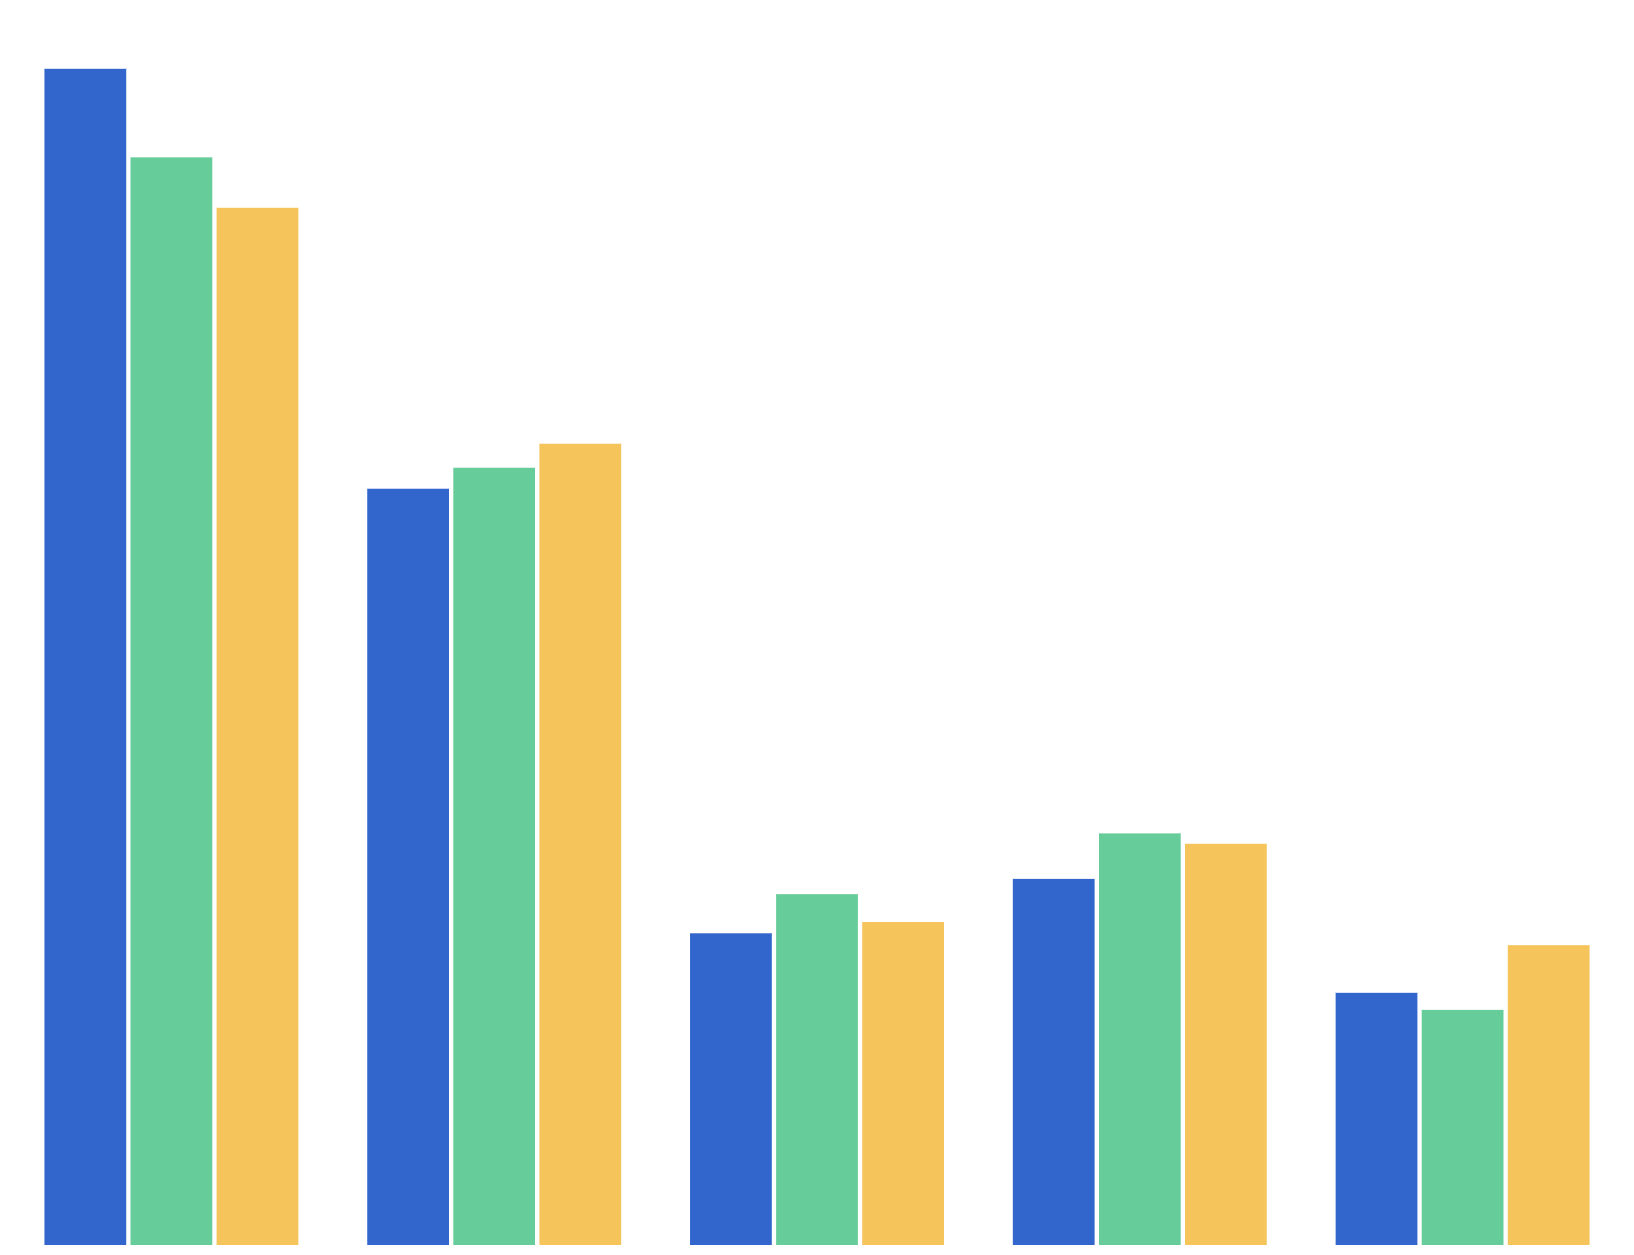
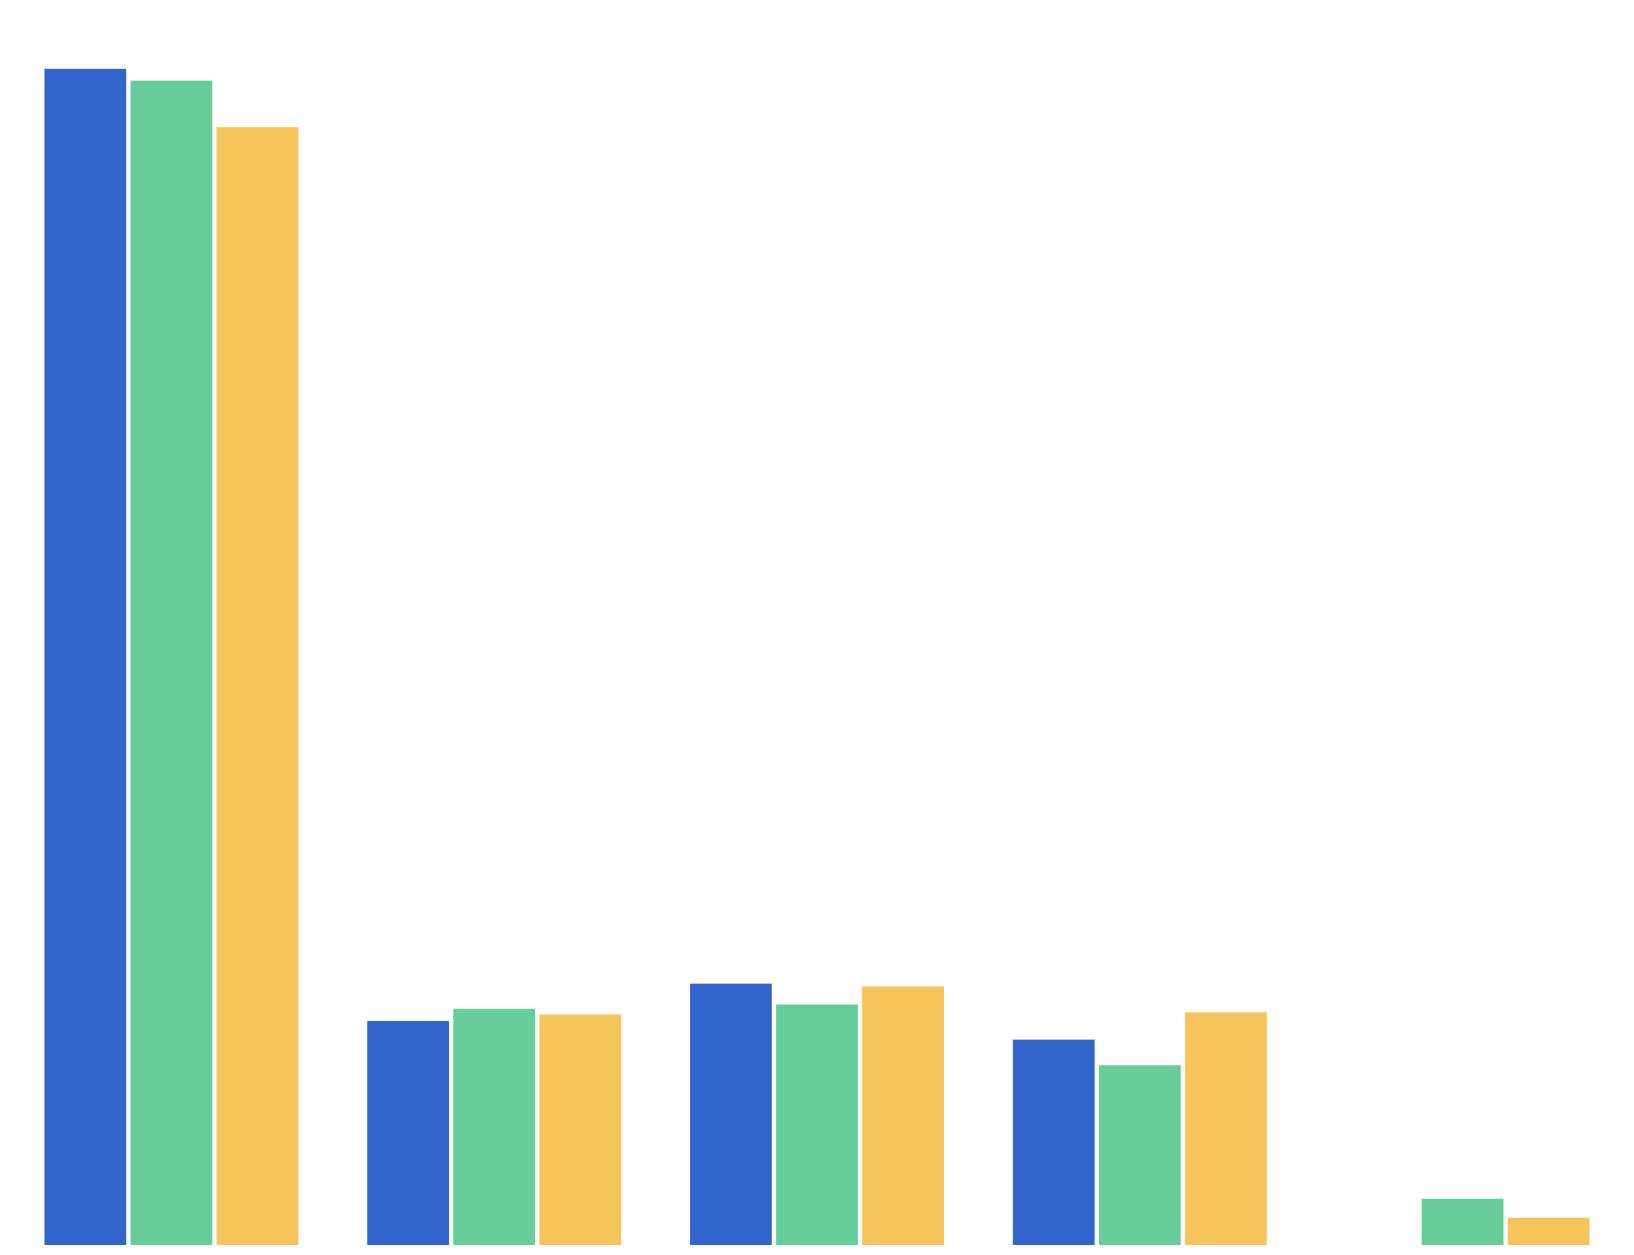
Current smoking status
Year 10 snapshot
1999–2016
Prevalence Initiation
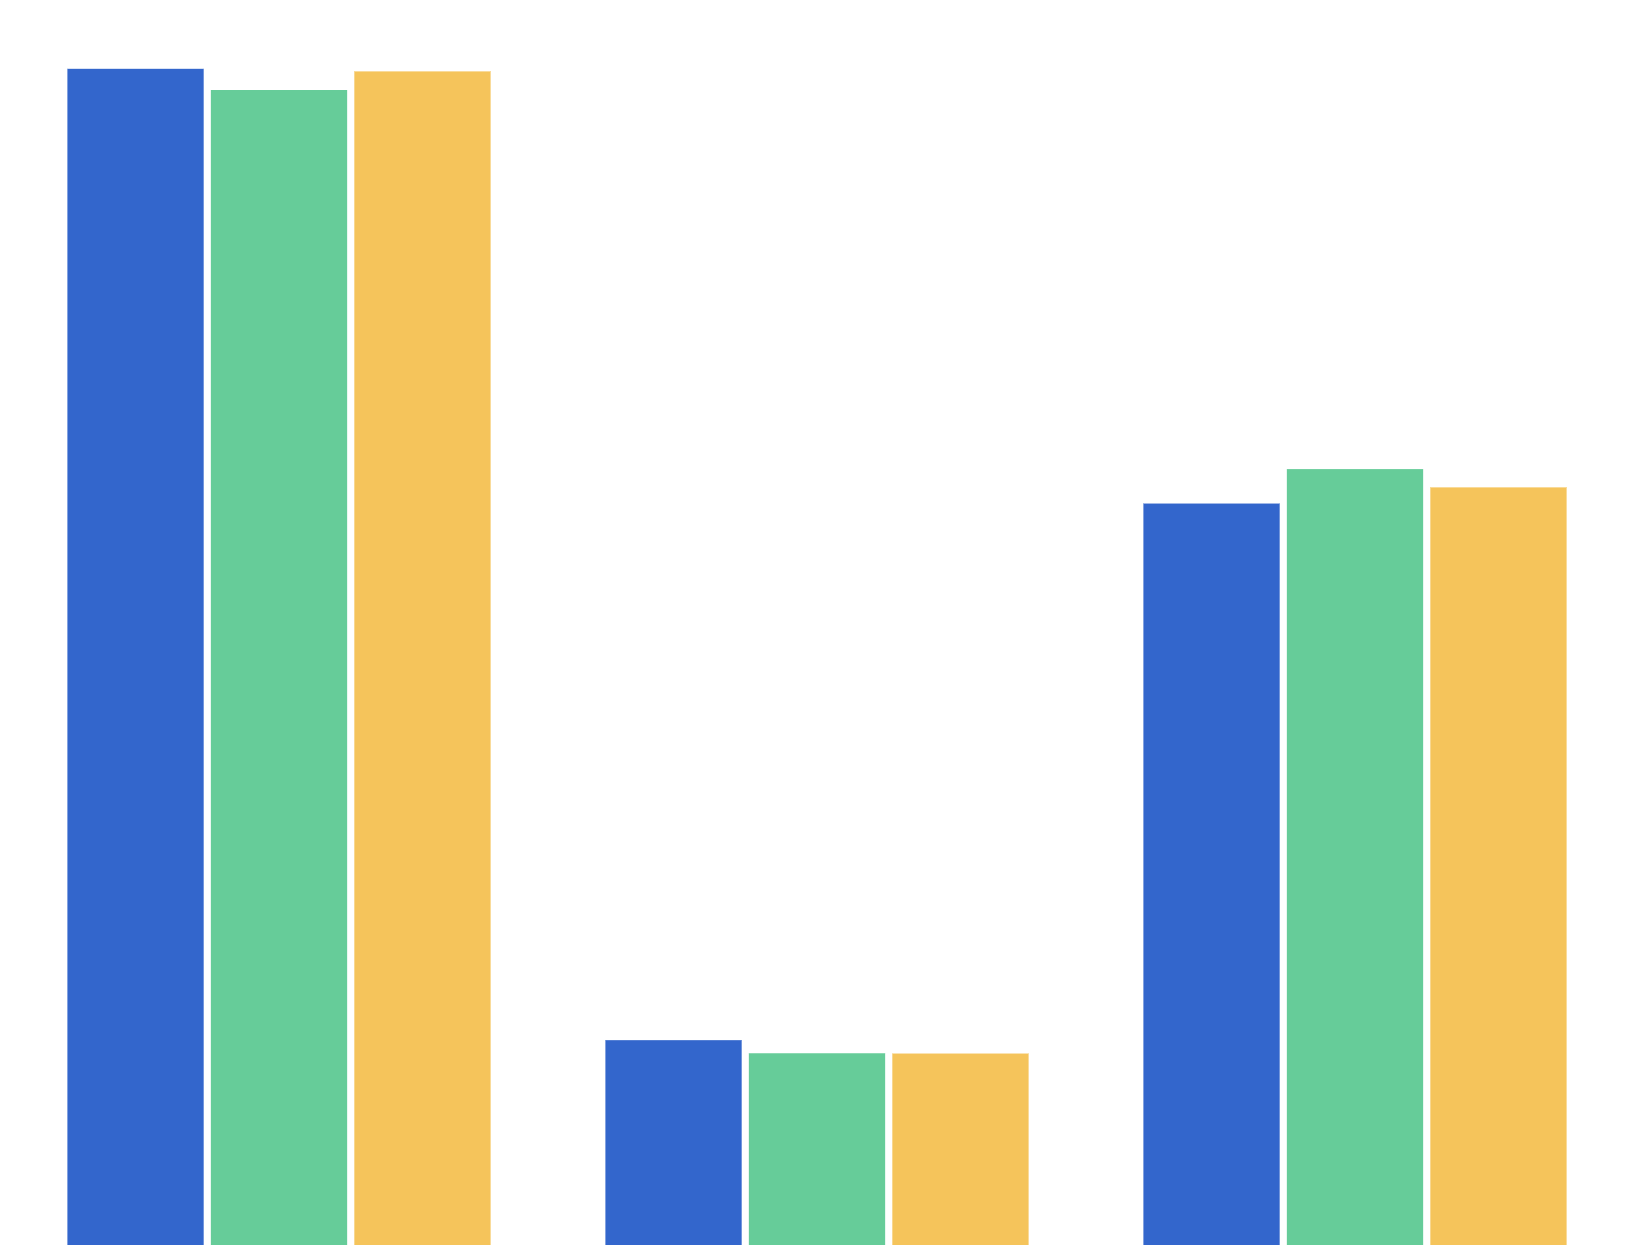
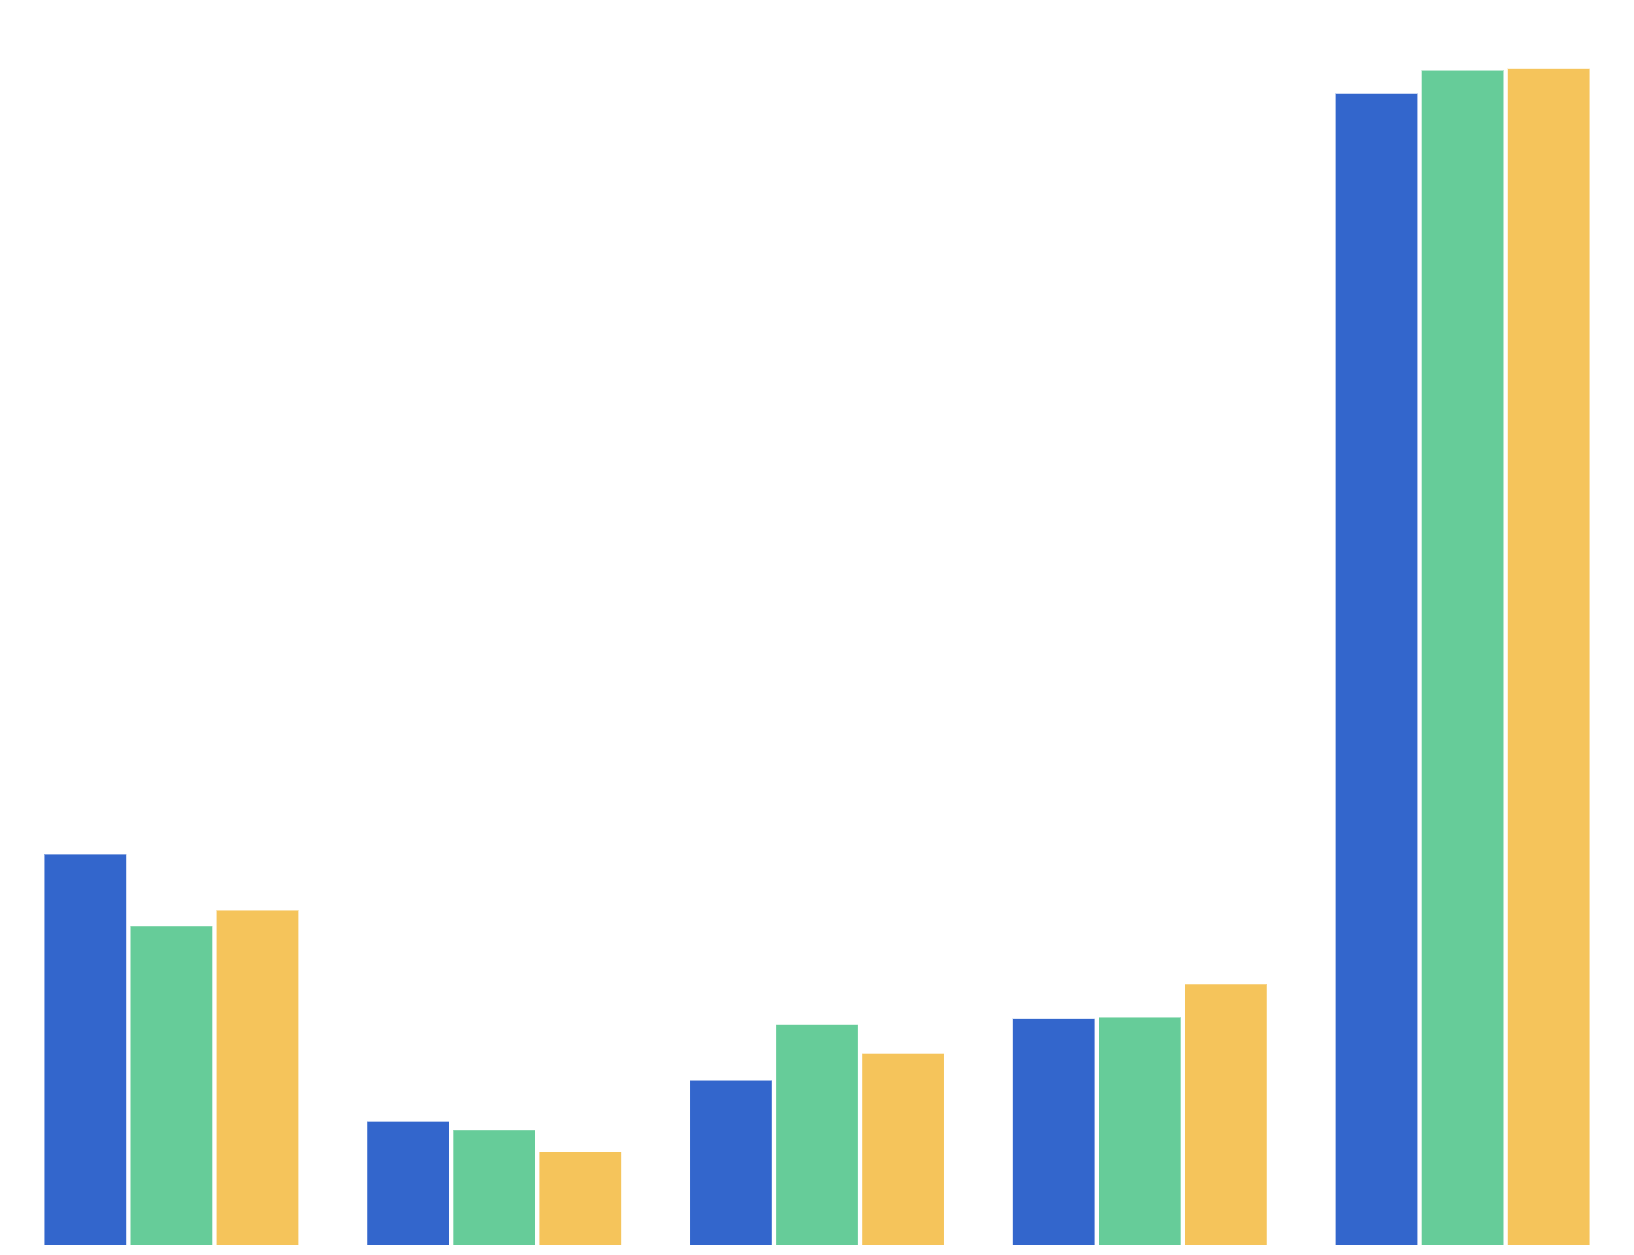
Tried a cigarette for the first time in the past 12 months
Year 10 snapshot
2012–2014
Initiation
Past year quit attempts
Year 10 snapshot
2010–2016
Cessation Initiation
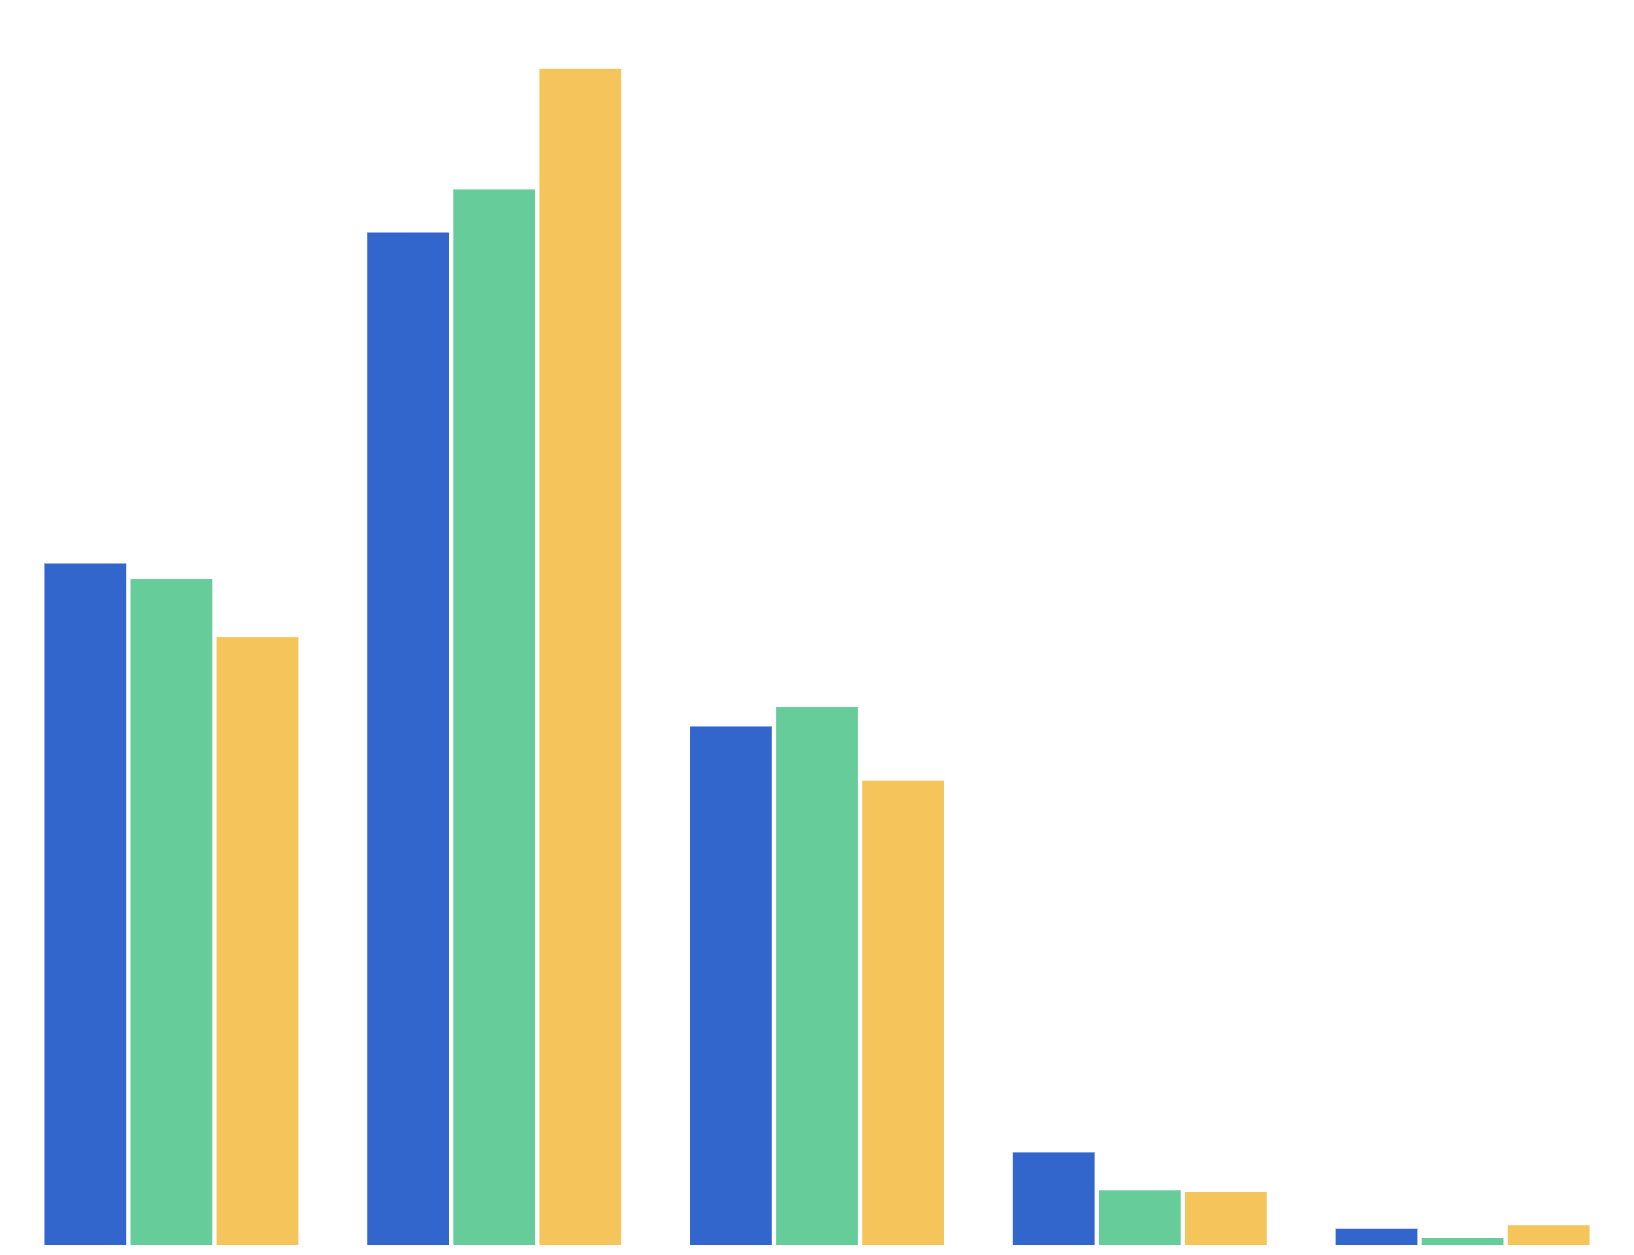
Type of cigarette usually smoked
Year 10 snapshot
2005–2016
Initiation Consumption
Likelihood of smoking a cigarette offered by a best friend
Year 10 snapshot
2006–2016
Initiation
Likelihood of smoking a cigarette in the next 12 months
Year 10 snapshot
2005–2016
Initiation

People smoke inside at home
Year 10 snapshot
2001–2016
Initiation Second-hand smoke

Someone smoked in your presence while travelling in a car or van during the past 7 days
Year 10 snapshot
2006–2016
Initiation Second-hand smoke
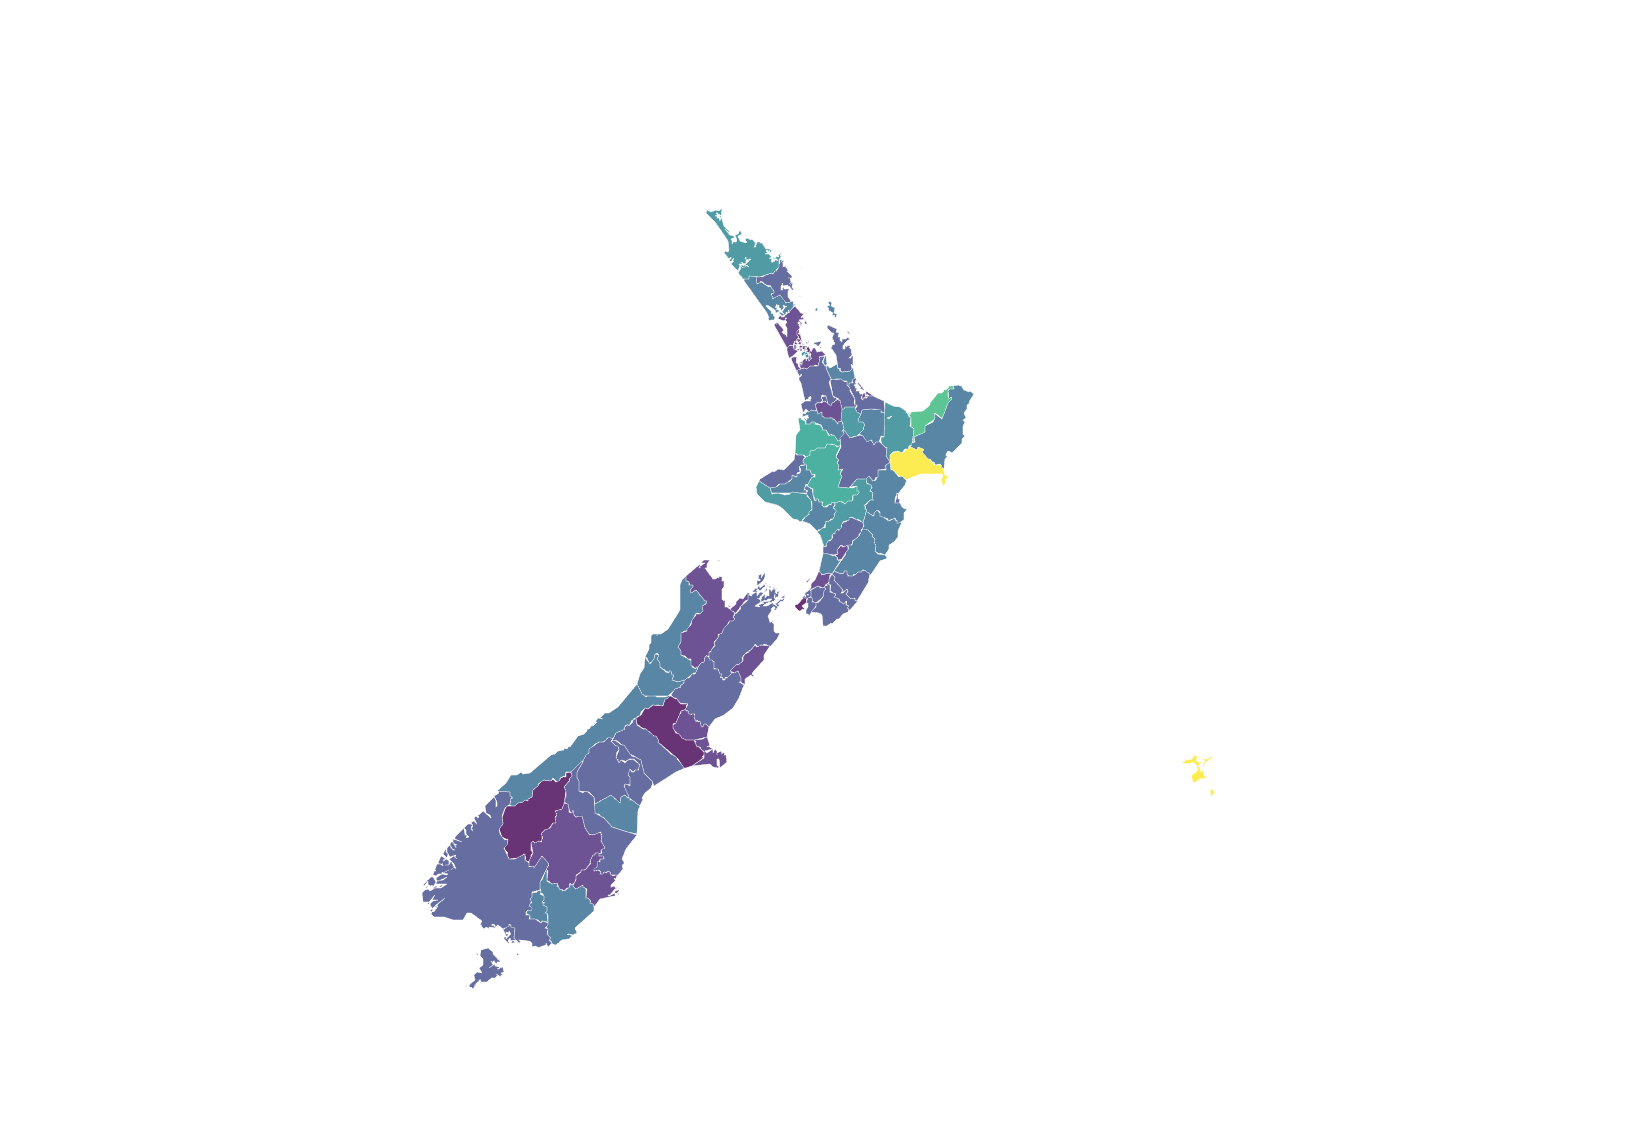
Cigarette smoking behaviour prevalence maps (2013, 2018, & 2023)
New Zealand Census
2013–2023
GIS Prevalence
Ever smoked tobacco
Health and Lifestyles Survey
2008–2018
Prevalence
Ever smoked 100 cigarettes
Health and Lifestyles Survey
2008–2010
Prevalence
Frequency smoke cigarettes (ever smoked)
Health and Lifestyles Survey
2008–2018
Prevalence
Frequency smoke cigarettes (adults 15+)
Health and Lifestyles Survey
2008–2018
Prevalence
Smoking status
Health and Lifestyles Survey
2008–2018
Prevalence
When stopped smoking (adults who no longer smoke)
Health and Lifestyles Survey
2008–2018
Cessation
Number of quit attempts in past 12 months (smokers and recent quitters)
Health and Lifestyles Survey
2008–2018
Cessation
People should be able to smoke indoors at a marae
Health and Lifestyles Survey
2008–2010
Attitudes
People should be able to smoke outdoors at a marae
Health and Lifestyles Survey
2008–2010
Attitudes
People should be able to smoke outdoors on sport fields
Health and Lifestyles Survey
2008–2012
Attitudes
Smoking is a real problem in New Zealand
Health and Lifestyles Survey
2008–2010
Attitudes
Society disapproves of smoking
Health and Lifestyles Survey
2008–2010
Attitudes
Tobacco companies should not be allowed to promote cigarettes and tobacco with different brand names and packaging
Health and Lifestyles Survey
2008–2010
Attitudes
The government should do more to reduce the harm done by smoking
Health and Lifestyles Survey
2008–2012
Attitudes
The number of places allowed to sell cigarettes and tobacco should be reduced to make them less easily available
Health and Lifestyles Survey
2008–2018
Attitudes
There should be complete bans on displays of cigarettes and tobacco inside shops
Health and Lifestyles Survey
2008–2014
Attitudes
Tax on cigarettes and tobacco should be increased and all the extra money used to help smokers wanting to quit
Health and Lifestyles Survey
2008–2010
Attitudes
Cigarettes and tobacco should not be sold in New Zealand in 10 years' time
Health and Lifestyles Survey
2008–2014
Attitudes
Frequency of lung cancer registrations and mortality
New Zealand Cancer Registry and Mortality Collection
1948–2013
Mortality
Population-standardised rates of lung cancer registrations and mortality
New Zealand Cancer Registry and Mortality Collection
1948–2013
Mortality

Population-standardised rates of lung cancer registrations and mortality by Ethnicity
New Zealand Cancer Registry and Mortality Collection
1996–2013
Mortality
Current smokers
New Zealand Health Survey (3-year pooled)
2011–2023
Prevalence
Daily smoker and daily vaper
New Zealand Health Survey (3-year pooled)
2017–2023
Prevalence Vaping
Daily smoker and/or daily vaper
New Zealand Health Survey (3-year pooled)
2017–2023
Prevalence Vaping
Daily smoker only
New Zealand Health Survey (3-year pooled)
2017–2023
Prevalence
Daily smokers
New Zealand Health Survey (3-year pooled)
2011–2023
Prevalence
Daily vaper only
New Zealand Health Survey (3-year pooled)
2017–2023
Prevalence Vaping
Daily vaping
New Zealand Health Survey (3-year pooled)
2017–2023
Prevalence Vaping
Ever tried vaping
New Zealand Health Survey (3-year pooled)
2017–2023
Prevalence Vaping
Ex-smokers
New Zealand Health Survey (3-year pooled)
2011–2023
Prevalence
Heavy smokers (among daily smokers)
New Zealand Health Survey (3-year pooled)
2011–2023
Prevalence
Mean number of cigarettes
New Zealand Health Survey (3-year pooled)
2011–2023
Mean
Monthly vaping
New Zealand Health Survey (3-year pooled)
2017–2023
Prevalence Vaping
Smoking quit rate
New Zealand Health Survey (3-year pooled)
2011–2023
Prevalence
Current smokers
New Zealand Health Survey
2011–2025
Tier 1 statistic Prevalence
Daily smoker and daily vaper
New Zealand Health Survey
2015–2025
Prevalence Vaping
Daily smoker and/or daily vaper
New Zealand Health Survey
2015–2025
Prevalence Vaping
Daily smoker only
New Zealand Health Survey
2015–2025
Prevalence
Daily smokers
New Zealand Health Survey
2011–2025
Prevalence
Daily vaper only
New Zealand Health Survey
2015–2025
Prevalence Vaping
Daily vaping
New Zealand Health Survey
2015–2025
Prevalence Vaping
Ever tried vaping
New Zealand Health Survey
2015–2025
Prevalence Vaping
Ex-smokers
New Zealand Health Survey
2011–2025
Prevalence
Heavy smokers (among daily smokers)
New Zealand Health Survey
2011–2025
Prevalence
Mean number of cigarettes
New Zealand Health Survey
2011–2025
Mean
Monthly vaping
New Zealand Health Survey
2015–2025
Prevalence Vaping
Smoking quit rate
New Zealand Health Survey
2011–2025
Prevalence
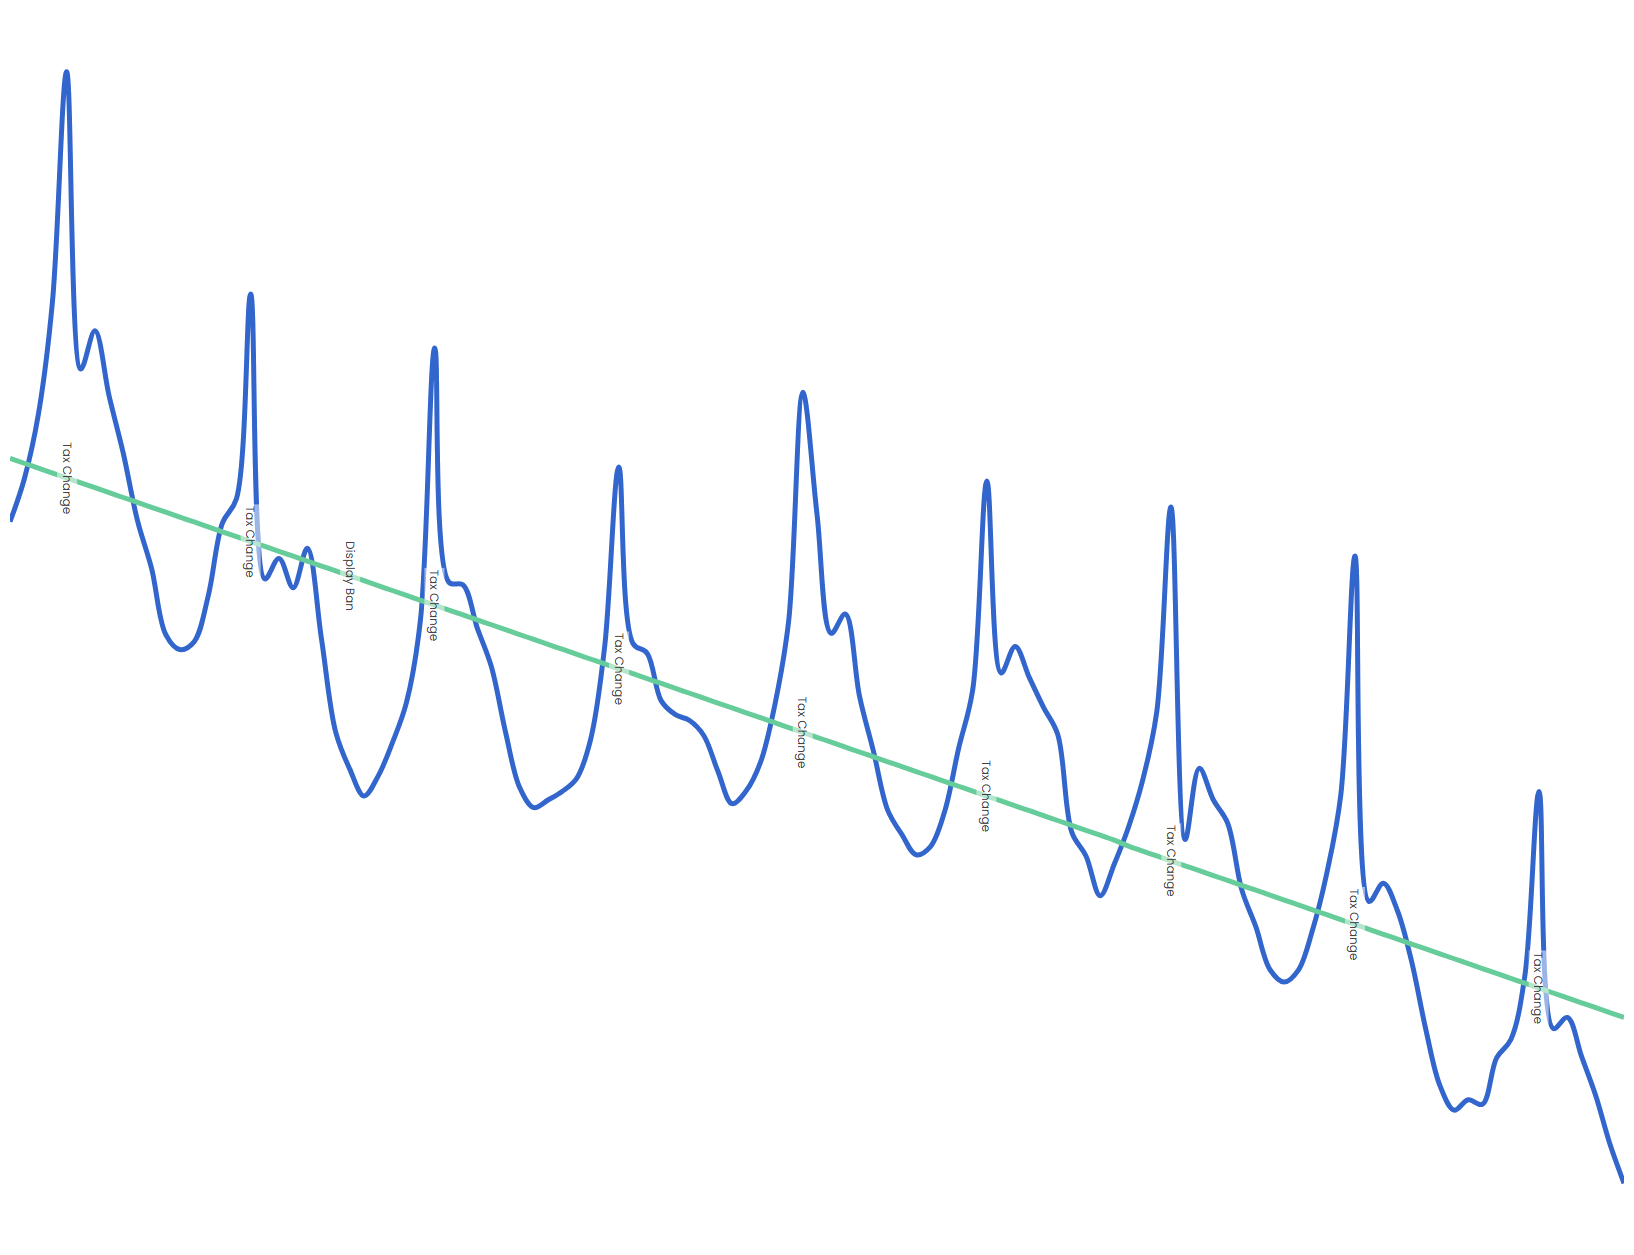
Perceived impact of tobacco cost
New Zealand Smoking Monitor
2011–2015
Policy
Pressure from others to quit
New Zealand Smoking Monitor
2011–2016
Cessation

Intention to quit
New Zealand Smoking Monitor
2011–2016
Cessation
Self-efficacy in quitting
New Zealand Smoking Monitor
2011–2016
Cessation

Reduced tobacco consumption recently
New Zealand Smoking Monitor
2011–2016
Consumption
Switched to a cheaper tobacco type recently
New Zealand Smoking Monitor
2011–2016
Consumption
Switched to a cheaper brand recently
New Zealand Smoking Monitor
2011–2016
Consumption
Smoked duty free cigarettes recently
New Zealand Smoking Monitor
2011–2016
Consumption
Exposure to tobacco control advertising
New Zealand Smoking Monitor
2011–2016
Media Exposure
Exposure to news stories
New Zealand Smoking Monitor
2011–2016
Media Exposure
Exposure to smoking on TV or in movies
New Zealand Smoking Monitor
2011–2016
Media Exposure
Awareness of policy change
New Zealand Smoking Monitor
2011–2016
Policy
Smoking prevalence based primarily on AC Nielsen data from 1983 to 2017
Other datasets
1983–2017
Prevalence
Tobacco Available for Consumption from 1973 to 2009
Other datasets
1973–2009
Consumption
Cigarettes Available for Consumption from 1973 to 2009
Other datasets
1973–2009
Consumption
Quit attempts from July 2005 to June 2015 (the Quit Group)
Quitline
2005–2015
Cessation
Quit attempts from November 2015 to September 2017 (Homecare Medical)
Quitline
2015–2017
Cessation
Referral Source
Smoking Cessation Services
2013–2016
Cessation
Referral Response Time
Smoking Cessation Services
2013–2016
Cessation
Clients Numbers Intervention Other Than Cessation
Smoking Cessation Services
2013–2016
Cessation
Number Of Clients Enrolling On The Programme
Smoking Cessation Services
2013–2016
Cessation

Abstinence Rates
Smoking Cessation Services
2013–2016
Cessation
Age Group
Smoking Cessation Services
2013–2016
Cessation
Gender
Smoking Cessation Services
2013–2016
Cessation
Ethnic Group
Smoking Cessation Services
2013–2016
Cessation
Pharmacotherapy
Smoking Cessation Services
2013–2016
Cessation
Time To First Cigarette
Smoking Cessation Services
2013–2016
Cessation
Number of Sessions (Followups)
Smoking Cessation Services
2013–2016
Cessation
Validated 4-Week Abstinence Status
Smoking Cessation Services
2013–2016
Cessation
Self Reported 4-Week Abstinence Status
Smoking Cessation Services
2013–2016
Cessation
Validated 3-Month Abstinence Status
Smoking Cessation Services
2013–2016
Cessation
Self Reported 3-Month Abstinence Status
Smoking Cessation Services
2013–2016
Cessation
Gum Prescribed & Distributed
Smoking Cessation Services
2013–2016
Cessation
Patches Prescribed & Distributed
Smoking Cessation Services
2013–2016
Cessation
Therapy Prescribed & Distributed
Smoking Cessation Services
2013–2016
Cessation
Equivalent price per cigarette - Average price per cigarette (RYO converted to equivalent cigarette price)
Tobacco sales data
2010–2016
Consumption
Tobacco Sales - 4 Weekly Equivalent Cigarette Sales Volume
Tobacco sales data
2010–2019
Consumption
Early uptake of cigarette smoking (first tried a cigarette before age 10)
Youth Insights Survey
2008–2014
Initiation
Tried a cigarette for the first time in past year
Youth Insights Survey
2010–2014
Initiation
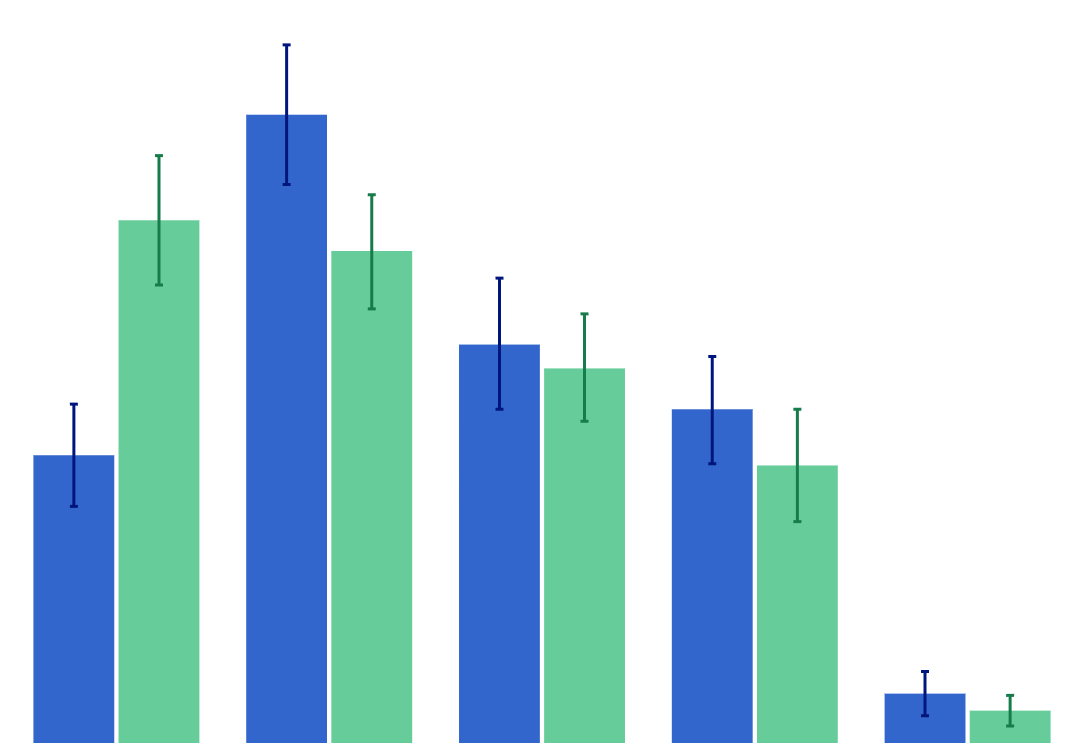
Number of cigarettes smoked in life
Youth Insights Survey
2012–2018
Initiation Consumption
Perception of whether it would be difficult to quit once someone has started smoking
Youth Insights Survey
2008–2018
Cessation Initiation
Perception of whether student could get cigarettes from friends
Youth Insights Survey
2010–2018
Initiation
Perception of whether student could get cigarettes from their family or home
Youth Insights Survey
2010–2014
Initiation
Perception of whether student could get cigarettes from a shop
Youth Insights Survey
2012–2014
Initiation
Past-week exposure to second-hand smoke at home
Youth Insights Survey
2008–2018
Initiation Second-hand smoke
Past-week exposure to second-hand smoke in a vehicle
Youth Insights Survey
2008–2018
Initiation Second-hand smoke
Agreement that parents have set rules about not smoking cigarettes
Youth Insights Survey
2008–2014
Initiation
Agreement that parents would be upset if student was caught smoking cigarettes
Youth Insights Survey
2008–2018
Initiation
Agreement that there is no harm in having a cigarette once in a while
Youth Insights Survey
2010–2018
Attitudes Initiation
Agreement that don't want to end up a smoker
Youth Insights Survey
2012–2018
Attitudes Initiation
Agreement that by 2025 hardly anybody will be smoking
Youth Insights Survey
2012–2018
Policy Attitudes Initiation
Agreement that smoking in cars should be banned when children are in them
Youth Insights Survey
2012–2018
Policy Attitudes Initiation
Agreement that tobacco companies should not be allowed to promote cigarettes and tobacco with cool looking packs
Youth Insights Survey
2012–2016
Policy Attitudes Initiation
Agreement that want to live in a country where no one smokes
Youth Insights Survey
2012–2018
Attitudes Initiation
Agreement that smoking should be banned in all outdoor places where young people go
Youth Insights Survey
2010–2018
Policy Attitudes Initiation
Ever tried electronic cigarettes
Youth Insights Survey
2012–2018
Vaping Initiation